3D Scans of Museum artifacts
- Subject:
- Applied Science
- Education
- Material Type:
- Diagram/Illustration
- Provider:
- National Air and Space Museum
- Author:
- National Air and Space Museum
- Date Added:
- 10/01/2022

3D Scans of Museum artifacts

This is a book containing over 200 problems spanning over 70 specific topic areas covered in a typical Algebra II course. Learners can encounter a selection of application problems featuring astronomy, earth science and space exploration, often with more than one example in a specific category. Learners will use mathematics to explore science topics related to a wide variety of NASA science and space exploration endeavors. Each problem or problem set is introduced with a brief paragraph about the underlying science, written in a simplified, non-technical jargon where possible. Problems are often presented as a multi-step or multi-part activities. This book can be found on the Space Math@NASA website.
This activity allows students to practice describing pictures. Based on level, students will either describe what the image is showing, create a caption for the image, or tell a story behind the image.

The Human Spaceflight collection spans decades of achievements from the first U.S. manned Mercury missions through Apollo, the Space Shuttle, and the International Space Station.
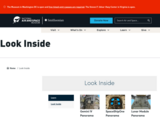
Collection of panoramic cockpit images of several Museum artifacts.
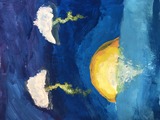
This particular Color, Symbol, Image (CSI) lesson is designed for implementation by an art teacher with 6th-grade students. However, the strategy can be utilized in other disciplines for the purpose of Making Thinking Visible. Parental consent was granted to share a student sample of the final product for this lesson, which is pictured above. The title card the 6th-grade student, Boston, created included the following description: "The sunrise in the painting represents the help and hope that Houston is getting. Also, the clouds are eyes, and the sun is a mouth. The face is crying. This represents my sympathy for Texas." Boston had selected "Rising floodwaters overwhelm Houston, other parts of Texas", the third option from Newsela provided in the Google Slides. The choices for articles can be updated each year prior to the activity.

This course explores the reciprocal relationships among design, science, and technology by covering a wide range of topics including industrial design, architecture, visualization and perception, design computation, material ecology, and environmental design and sustainability. Students will examine how transformations in science and technology have influenced design thinking and vice versa, as well as develop methodologies for design research and collaborate on design solutions to interdisciplinary problems.
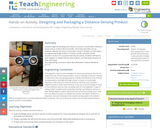
Students begin by following instructions to connect a Sunfounder Ultrasonic Sensor and an Arduino Microcontroller. Once they have them set up, students calibrate the sensor and practice using it. Students are then given an engineering design problem: to build a product that will use the ultrasonic sensors for a purpose that they all specify. Students will have to work together to design and test their product, and ultimately present it to their classmates.

This is an activity about the solar activity cycle. Learners will construct a graph to identify a pattern of the number of observed sunspots and the number of coronal mass ejections emitted by the Sun over a fifteen year time span. A graphing calculator is recommended, but not required, for this activity. This is the second activity in the Solar Storms and You: Exploring the Wind from the Sun educator guide.

Filtering is the process of removing or separating the unwanted part of a mixture. In signal processing, filtering is specifically used to remove or extract part of a signal, and this can be accomplished using an analog circuit or a digital device (such as a computer). In this lesson, students learn the impact filtering can have on different types of signals, the concepts of frequency and spectrum, and the connections these topics have to real-world signals such as musical signals. Students also learn the roles that these concepts play in designing different types of filters. The lesson content prepares students for the associated activity in which they use an online demo and a variety of filters to identify the message in a distress signal heavily corrupted by noise.
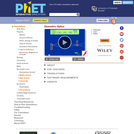
How does a lens form an image? See how light rays are refracted by a lens. Watch how the image changes when you adjust the focal length of the lens, move the object, move the lens, or move the screen.

During this lesson, students start to see the data structure they will use to store their images, towards finding a solution to this unit's Grand Challenge. Students are introduced to two-dimensional arrays and vector classes. Then they are guided to see that a vector class is the most efficient way of storing the data for their images. Grand Challenge: To write a program to simulate peripheral vision by merging two images.

The Image Data Resource (IDR) is a public repository of reference image datasets from published scientific studies. IDR enables access, search and analysis of these highly annotated datasets. Datasets are usually CC0 or CC BY 4.0.
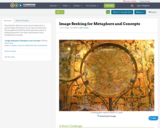
Searching for objects is easy, just put keywords in a search engine (but please, use an open-licensed one) - The ImageSeek method includes questions aimed at finding keywords to use when searching for more metaphorical concepts,

Ensemble de composant soft/hard permettant de produire des images par ordinateur.

This social media literacy unit introduces students to foundational skills in analyzing images and social media posts. It also reenforces critical thinking questions that can be applied to various forms of media. This unit was taught to 9th grade students but is easily adaptible to a range of secondary classrooms. It was also taught in conjunction with another unit focused on social media platforms and content.

This social media literacy unit introduces students to foundational skills in analyzing images and social media posts. It also reenforces critical thinking questions that can be applied to various forms of media. This unit was taught to 9th grade students but is easily adaptible to a range of secondary classrooms. It was also taught in conjunction with another unit focused on social media platforms and content.

This social media literacy unit introduces students to foundational skills in analyzing images and social media posts. It also reenforces critical thinking questions that can be applied to various forms of media. This unit was taught to 9th grade students but is easily adaptible to a range of secondary classrooms. It was also taught in conjunction with another unit focused on social media platforms and content.

This is a unit on learning how to use a vector editing program (gravit.io) used for my online graphic design class. This program is free and runs in the browser so was optimal for my students using chromebooks. Each of the 6 lessons has a written lesson tutorial with images, as well as a screencast video that goes over that lesson. 4 of the 6 lessons have an assignment associated with them. There is an outline for what each lesson goes over listed underneath the links for that lesson. All written tutorials, lessons and assignments are in google docs. Lesson 1 - Basics | Screencast Lesson 1 | Assignment Lesson 1What is Gravit.io?Canvas & ZoomSelecting ObjectsMoving objectsCopy/Paste/Delete/DuplicateSupersize, Rotate, FlipGrouping & UngroupingArranging ObjectsAlign and DistributeSavingLesson 2 - Shapes, Paths, Pen | Screencast Lesson 2 | Assignment Lesson 2Basic ShapesBasic Star-based ShapesAdjusting ObjectsShapes vs. PathPath OperationsPen ToolLesson 3 - More Paths & Type | Screencast Lesson 3 | Assignment Lesson 3 CC BY SA 3.0 Rebecca EricksonDrawing Curves with the PenTypes of NodesThe Freehand Tool & SimplifyFills & BordersThe Type ToolLesson 4 - More on Type | Screencast Lesson 4 | Assignment Lesson 4Working with Type: Text vs. PathsType AlignmentCharacter, Word and Line SpacingPutting Type on PathsLesson 5 - Gradients & Textures | Screencast Lesson 5Using the Gradient ToolFine-tuning Gradient PositionAdding More Points to a GradientWorking with TexturesAdding NoiseLesson 6 - Clipart & Vectorizing Images | Screencast Lesson 6About openclipart.orgImporting Open Clip Art into GravitVectorizing Images

In this course students create digital visual images and analyze designs from historical and theoretical perspectives with an emphasis on art and design, examining visual experience in broad terms, and from the perspectives of both creators and viewers. The course addresses key topics such as: image making as a cognitive and perceptual practice, the production of visual significance and meaning, and the role of technology in creating and understanding digitally produced images. Students will be given design problems growing out of their reading and present solutions using technologies such as the Adobe Creative Suite and/or similar applications.