A+ Click is an interactive collection of more than 3700 math problems …
A+ Click is an interactive collection of more than 3700 math problems and answers for K-1 K-12 school program. It defines the personal level of math knowledge. You move up into the next level if you give 5 correct answers in a row. Practice makes perfect.
This textbook is part of the OpenIntro Statistics series and offers complete …
This textbook is part of the OpenIntro Statistics series and offers complete coverage of the high school AP Statistics curriculum. Real data and plenty of inline examples and exercises make this an engaging and readable book. Links to lecture slides, video overviews, calculator tutorials, and video solutions to selected end of chapter exercises make this an ideal choice for any high school or Community College teacher. In fact, Portland Community College recently adopted this textbook for its Introductory Statistics course, and it estimates that this will save their students $250,000 per year. Find out more at: openintro.org/ahss
View our video tutorials here: openintro.org/casio openintro.org/TI
Students build a formal understanding of probability, considering complex events such as …
Students build a formal understanding of probability, considering complex events such as unions, intersections, and complements as well as the concept of independence and conditional probability. The idea of using a smooth curve to model a data distribution is introduced along with using tables and technology to find areas under a normal curve. Students make inferences and justify conclusions from sample surveys, experiments, and observational studies. Data is used from random samples to estimate a population mean or proportion. Students calculate margin of error and interpret it in context. Given data from a statistical experiment, students use simulation to create a randomization distribution and use it to determine if there is a significant difference between two treatments.
Find the rest of the EngageNY Mathematics resources at https://archive.org/details/engageny-mathematics.
(Nota: Esta es una traducción de un recurso educativo abierto creado por …
(Nota: Esta es una traducción de un recurso educativo abierto creado por el Departamento de Educación del Estado de Nueva York (NYSED) como parte del proyecto "EngageNY" en 2013. Aunque el recurso real fue traducido por personas, la siguiente descripción se tradujo del inglés original usando Google Translate para ayudar a los usuarios potenciales a decidir si se adapta a sus necesidades y puede contener errores gramaticales o lingüísticos. La descripción original en inglés también se proporciona a continuación.)
Los estudiantes crean una comprensión formal de la probabilidad, considerando eventos complejos como sindicatos, intersecciones y complementos, así como el concepto de independencia y probabilidad condicional. La idea de usar una curva suave para modelar una distribución de datos se introduce junto con el uso de tablas y tecnología para encontrar áreas bajo una curva normal. Los estudiantes hacen inferencias y justifican conclusiones de encuestas de muestra, experimentos y estudios de observación. Los datos se usan de muestras aleatorias para estimar una media o proporción de población. Los estudiantes calculan el margen de error y lo interpretan en contexto. Dados los datos de un experimento estadístico, los estudiantes usan la simulación para crear una distribución de aleatorización y lo usan para determinar si hay una diferencia significativa entre dos tratamientos.
Encuentre el resto de los recursos matemáticos de Engageny en https://archive.org/details/engageny-mathematics.
English Description: Students build a formal understanding of probability, considering complex events such as unions, intersections, and complements as well as the concept of independence and conditional probability. The idea of using a smooth curve to model a data distribution is introduced along with using tables and technology to find areas under a normal curve. Students make inferences and justify conclusions from sample surveys, experiments, and observational studies. Data is used from random samples to estimate a population mean or proportion. Students calculate margin of error and interpret it in context. Given data from a statistical experiment, students use simulation to create a randomization distribution and use it to determine if there is a significant difference between two treatments.
Find the rest of the EngageNY Mathematics resources at https://archive.org/details/engageny-mathematics.
Biology is designed for multi-semester biology courses for science majors. It is …
Biology is designed for multi-semester biology courses for science majors. It is grounded on an evolutionary basis and includes exciting features that highlight careers in the biological sciences and everyday applications of the concepts at hand. To meet the needs of today’s instructors and students, some content has been strategically condensed while maintaining the overall scope and coverage of traditional texts for this course. Instructors can customize the book, adapting it to the approach that works best in their classroom. Biology also includes an innovative art program that incorporates critical thinking and clicker questions to help students understand—and apply—key concepts.
By the end of this section, you will be able to:Describe the …
By the end of this section, you will be able to:Describe the scientific reasons for the success of Mendel’s experimental workDescribe the expected outcomes of monohybrid crosses involving dominant and recessive allelesApply the sum and product rules to calculate probabilities
A free online textbook for biophysical chemistry. The book covers probability, statistics, …
A free online textbook for biophysical chemistry. The book covers probability, statistics, thermodynamics, kinetics, Monte Carlo methods, biochemistry, diffusion, stochastic processes, and others.
This video module presents an introduction to cryptography - the method of …
This video module presents an introduction to cryptography - the method of sending messages in such a way that only the intended recipients can understand them. In this very interactive lesson, students will build three different devices for cryptography and will learn how to encrypt and decrypt messages. There are no prerequisites for this lesson, and it has intentionally been designed in a way that can be adapted to many audiences. It is fully appropriate in a high school level math or computer science class where the teacher can use it to motivate probability/statistics or programming exercises. nteractive lesson, students will learn to build the cryptography devices and will learn how to send and ''crack'' secret messages.
Submitted as part of the California Learning Resource Network (CLRN) Phase 3 …
Submitted as part of the California Learning Resource Network (CLRN) Phase 3 Digital Textbook Initiative (CA DTI3), CK-12 Advanced Probability and Statistics introduces students to basic topics in statistics and probability but finishes with the rigorous topics an advanced placement course requires. Includes visualizations of data, introduction to probability, discrete probability distribution, normal distribution, planning and conducting a study, sampling distributions, hypothesis testing, regression and correlation, Chi-Square, analysis of variance, and non-parametric statistics.
This textbook covers Algebra II and Trigonometry topics with chapters on equations …
This textbook covers Algebra II and Trigonometry topics with chapters on equations and inequalities, linear equations and functions, systems of linear equations and inequalities, matrices, quadratic functions and more.
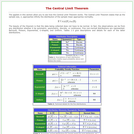
The applets in this section of Statistical Java allow you to see …
The applets in this section of Statistical Java allow you to see how the Central Limit Theorem works. The main page gives the characteristics of five non-normal distributions (Bernoulli, Poisson, Exponential, U-shaped, and Uniform).
This course covers the algorithmic and machine learning foundations of computational biology …
This course covers the algorithmic and machine learning foundations of computational biology combining theory with practice. We cover both foundational topics in computational biology, and current research frontiers. We study fundamental techniques, recent advances in the field, and work directly with current large-scale biological datasets.
With the growing availability and lowering costs of genotyping and personal genome …
With the growing availability and lowering costs of genotyping and personal genome sequencing, the focus has shifted from the ability to obtain the sequence to the ability to make sense of the resulting information. This course is aimed at exploring the computational challenges associated with interpreting how sequence differences between individuals lead to phenotypic differences in gene expression, disease predisposition, or response to treatment.
This subject is a computer-oriented introduction to probability and data analysis. It …
This subject is a computer-oriented introduction to probability and data analysis. It is designed to give students the knowledge and practical experience they need to interpret lab and field data. Basic probability concepts are introduced at the outset because they provide a systematic way to describe uncertainty. They form the basis for the analysis of quantitative data in science and engineering. The MATLAB® programming language is used to perform virtual experiments and to analyze real-world data sets, many downloaded from the web. Programming applications include display and assessment of data sets, investigation of hypotheses, and identification of possible casual relationships between variables. This is the first semester that two courses, Computing and Data Analysis for Environmental Applications (1.017) and Uncertainty in Engineering (1.010), are being jointly offered and taught as a single course.
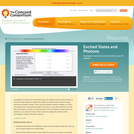
This concept-building activity contains a set of sequenced simulations for investigating how …
This concept-building activity contains a set of sequenced simulations for investigating how atoms can be excited to give off radiation (photons). Students explore 3-dimensional models to learn about the nature of photons as "wave packets" of light, how photons are emitted, and the connection between an atom's electron configuration and how it absorbs light. Registered users are able to use free data capture tools to take snapshots, drag thumbnails, and submit responses. This item is part of the Concord Consortium, a nonprofit research and development organization dedicated to transforming education through technology.
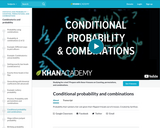
This lesson combines conditional probability and combinations to determine the probability of …
This lesson combines conditional probability and combinations to determine the probability of picking a fair coin given that it flipped 4 out of 6 heads. [Probability playlist: Lesson 16 of 29]
No restrictions on your remixing, redistributing, or making derivative works. Give credit to the author, as required.
Your remixing, redistributing, or making derivatives works comes with some restrictions, including how it is shared.
Your redistributing comes with some restrictions. Do not remix or make derivative works.
Most restrictive license type. Prohibits most uses, sharing, and any changes.
Copyrighted materials, available under Fair Use and the TEACH Act for US-based educators, or other custom arrangements. Go to the resource provider to see their individual restrictions.