Machine vision. Data wrangling. Reinforcement learning. What do these terms even mean? In AI 101, MIT researcher …
Machine vision. Data wrangling. Reinforcement learning. What do these terms even mean? In AI 101, MIT researcher Brandon Leshchinskiy offers an introduction to artificial intelligence that’s designed specifically for those with little to no background in the subject. The workshop starts with a summary of key concepts in AI, followed by an interactive exercise where participants train their own algorithm. Finally, it closes with a summary of key takeaways and Q/A. All are welcome!
Learn the fundamentals of machine learning to help you correctly apply various …
Learn the fundamentals of machine learning to help you correctly apply various classification and regression machine learning algorithms to real-life problems.
This course covers empirical strategies for applied micro research questions. Our agenda …
This course covers empirical strategies for applied micro research questions. Our agenda includes regression and matching, instrumental variables, differences-in-differences, regression discontinuity designs, standard errors, and a module consisting of 8–9 lectures on the analysis of high-dimensional data sets a.k.a. “Big Data”.
This learning video continues the theme of an early BLOSSOMS lesson, Flaws …
This learning video continues the theme of an early BLOSSOMS lesson, Flaws of Averages, using new examples—including how all the children from Lake Wobegon can be above average, as well as the Friendship Paradox. As mentioned in the original module, averages are often worthwhile representations of a set of data by a single descriptive number. The objective of this module, once again, is to simply point out a few pitfalls that could arise if one is not attentive to details when calculating and interpreting averages. Most students at any level in high school can understand the concept of the flaws of averages presented here. The essential prerequisite knowledge for this video lesson is the ability to calculate an average from a set of numbers. Materials needed include: pen and paper for the students; a blackboard or equivalent; and coins (one per student) or something similar that students can repeatedly use to create a random event with equal chances of the two outcomes (e.g. flipping a fair coin). The coins or something similar are recommended for one of the classroom activities, which will demonstrate the idea of regression toward the mean. Another activity will have the students create groups to show how the average number of friends of friends is greater than or equal to the average number of friends in a group, which is known as The Friendship Paradox. The lesson is designed for a typical 50-minute class session.
The IOT services are for customer convenience, control in online booking IOT …
The IOT services are for customer convenience, control in online booking IOT services such as radio station, smart coffee makers, dim lights and energy programmed lights. Our System will able to recommend the valid customer opinion by analyzing UAE, UK and Oman hotel aspects like services, value, cleanliness and location from customers’ reviews. it include the Big Analytics, Hadoop, HDFS, Sentiment Analytics, Emotion Analytics, ANOVA in Map-Reduce.
This project will recommend a big data analytics tool for the customers, …
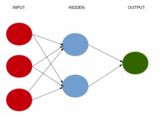
This project will recommend a big data analytics tool for the customers, ministry and hotels in Oman to adapt new hotel services after considering together hotel services with customer opinions. The IOT services are for customer convenience, control in online booking IOT services such as radio station, smart coffee makers, dim lights and energy programmed lights.The big data analytics will analyze the hotel information , rating and reviews of UK , Dubai to recomend aspect like services especially IOT services. The coverage of Analysis in R: Big data Analytics with Hadoop/HDFS Sentiment AnalysisEmotion Analysis Machine Learning K-mean , Regression and Neural NetworkAnova version to analyze Big data of 90k reviews
The aim of this course is to provide fundamental statistical concepts and …
The aim of this course is to provide fundamental statistical concepts and tools relevant to the practice of summarizing, analyzing, and visualizing data. This course will build your knowledge of the fundamental principles of biostatistical inference. The course will focus on linear regression and generalized linear regression models. We will use a variety of examples and exercises from scientific, medical, and public health research.
This course is an introduction to data cleaning, analysis and visualization. We …
This course is an introduction to data cleaning, analysis and visualization. We will teach the basics of data analysis through concrete examples. You will learn how to take raw data, extract meaningful information, use statistical tools, and make visualizations. This was offered as a non-credit course during the Independent Activities Period (IAP), which is a special 4-week term at MIT that runs from the first week of January until the end of the month.
This model-eliciting activity (MEA) challenges students to develop a model for predicting …
This model-eliciting activity (MEA) challenges students to develop a model for predicting the characteristics of a person who has committed a crime. Students work with real data on shoe length, height, and gender to develop the model. Students write a report to the crime victim that identifies a suspect and justifies their decision. The activity sets the stage for students to learn about regression models, and reinforces their understanding of central tendency and variability. It is suggested that this activity be used prior to a formal introduction to linear relationships.
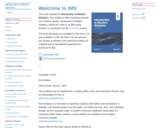
This textbook and its supplements, including slides, labs, and interactive tutorials, may be downloaded for free at openintro.org/book/ims.
This textbook is a derivative of OpenIntro Statistics 4th Edition and Introduction to Statistics with Randomization and Simulation 1st Edition by Diez, Barr, and Çetinkaya-Rundel, and it’s available under a Creative Commons Attribution-ShareAlike 3.0 Unported United States License. License details are available at the Creative Commons website: creativecommons.org.
Source files for this book may be found on GitHub at github.com/openintrostat/ims.
The book "Introductory Business Statistics" by Thomas K. Tiemann explores the basic …
The book "Introductory Business Statistics" by Thomas K. Tiemann explores the basic ideas behind statistics, such as populations, samples, the difference between data and information, and most importantly sampling distributions. The author covers topics including descriptive statistics and frequency distributions, normal and t-distributions, hypothesis testing, t-tests, f-tests, analysis of variance, non-parametric tests, and regression basics. Using real-world examples throughout the text, the author hopes to help students understand how statistics works, not just how to "get the right number."
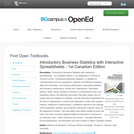
"Introductory Business Statistics with Interactive Spreadsheets - 1st Canadian Edition" is an …
"Introductory Business Statistics with Interactive Spreadsheets - 1st Canadian Edition" is an adaptation of Thomas K. Tiemann's book, "Introductory Business Statistics". In addition to covering basics such as populations, samples, the difference between data and information, and sampling distributions, descriptive statistics and frequency distributions, normal and t-distributions, hypothesis testing, t-tests, f-tests, analysis of variance, non-parametric tests, and regression basics, the following information has been added: the chi-square test and categorical variables, null and alternative hypotheses for the test of independence, simple linear regression model, least squares method, coefficient of determination, confidence interval for the average of the dependent variable, and prediction interval for a specific value of the dependent variable. This new edition also allows readers to learn the basic and most commonly applied statistical techniques in business in an interactive way -- when using the web version -- through interactive Excel spreadsheets. All information has been revised to reflect Canadian content.
Hands-on experience designing, conducting, analyzing, and presenting experiments on the structure and …
Hands-on experience designing, conducting, analyzing, and presenting experiments on the structure and processing of human language. Focuses on constructing, conducting, analyzing, and presenting an original and independent experimental project of publishable quality. Develops skills in reading and writing scientific research reports in cognitive science, including evaluating the methods section of a published paper, reading and understanding graphical displays and statistical claims about data, and evaluating theoretical claims based on experimental data. Instruction and practice in oral and written communication provided.
Students typically find linear regression analysis of data sets in a biology …
Students typically find linear regression analysis of data sets in a biology classroom challenging. These activities could be used in a Biology, Chemistry, Mathematics, or Statistics course. The collection provides student activity files with Excel instructions and Instructor Activity files with Excel instructions and solutions to problems.
Students will be able to perform linear regression analysis, find correlation coefficient, create a scatter plot and find the r-square using MS Excel 365. Students will be able to interpret data sets, describe the relationship between biological variables, and predict the value of an output variable based on the input of an predictor variable.
This video lecture describes manpower planning process, various trends affecting HR demand …
This video lecture describes manpower planning process, various trends affecting HR demand forecasting. It also discusses quantitative and qualitative techniques of HR Demand forecasting.
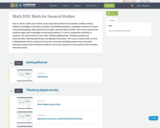
This is a three-credit course which covers topics that enhance the students’ …
This is a three-credit course which covers topics that enhance the students’ problem solving abilities, knowledge of the basic principles of probability/statistics, and guides students to master critical thinking/logic skills, geometric principles, personal finance skills. This course requires that students apply their knowledge to real-world problems. A TI-84 or comparable calculator is required. The course has four main units: Thinking Algebraically, Thinking Logically and Geometrically, Thinking Statistically, and Making Connections. This course is paired with a course in MyOpenMath which contains the instructor materials (including answer keys) and online homework system with immediate feedback. All course materials are licensed by CC-BY-SA unless otherwise noted.
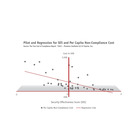
In this project, students will have the opportunity to explore regression in …
In this project, students will have the opportunity to explore regression in more detail. Specifically, they will be looking at how Covid-19 Stimulus money was distributed to each state in the country.
No restrictions on your remixing, redistributing, or making derivative works. Give credit to the author, as required.
Your remixing, redistributing, or making derivatives works comes with some restrictions, including how it is shared.
Your redistributing comes with some restrictions. Do not remix or make derivative works.
Most restrictive license type. Prohibits most uses, sharing, and any changes.
Copyrighted materials, available under Fair Use and the TEACH Act for US-based educators, or other custom arrangements. Go to the resource provider to see their individual restrictions.