In this activity, students are given a series of world maps showing …
In this activity, students are given a series of world maps showing the different configurations of the continents through geologic history. Working back from the present, students reconstruct the location of past surface currents based on the location of the continents and global atmospheric circulation patterns. Students also need to consider the importance of oceanic gyres in global heat transport by identifying warm and cold currents, as well as, areas that in the past were isolated from hemisphere-scale gyres and as a result, experienced unusually cold or warm conditions.
(Note: this resource was added to OER Commons as part of a batch upload of over 2,200 records. If you notice an issue with the quality of the metadata, please let us know by using the 'report' button and we will flag it for consideration.)
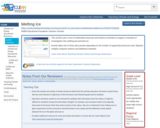
In this activity, students will learn the difference between sea ice and …
In this activity, students will learn the difference between sea ice and glaciers in relation to sea level rise. They will create and explore topographic maps as a means of studying sea level rise and how it will affect Alaska's coastline.
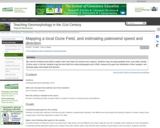
We visit the Pinebush dune field in eastern New York State (20 …
We visit the Pinebush dune field in eastern New York State (20 minutes from campus). Students map one large parabolic dune, and collect sample of dune sand. In the lab, students map the dune field from aerial photographs and a DEM, measure the grain size distribution of their samples, and estimate paleo-wind speed and direction.
(Note: this resource was added to OER Commons as part of a batch upload of over 2,200 records. If you notice an issue with the quality of the metadata, please let us know by using the 'report' button and we will flag it for consideration.)
This is a very simple but effective lesson that engages students with …
This is a very simple but effective lesson that engages students with drawing a map of their local environment, then annotating their map with environmental changes they've observed. The activity taps into higher order thinking because students are synthesizing physical, cultural, environmental, and personal factors and expressing them in a graphical format.
The goal of this assignment is threefold: 1) Reflect on the connection between social and ecological parts of the earth system that we observe in our own lives, 2) Gain experience with mapping change and using maps for sharing both data and personal stories of climate change, and 3) Provide a starting point for gauging our collective experience thinking about climate change.
Students map one large hairpin parabolic dune in the Pinebush Preserve. They …
Students map one large hairpin parabolic dune in the Pinebush Preserve. They also profile the slopes on both proximal and distal sides of the dune. As a group, we take an ~ 2m long core of the dune sand to sample the sand beneath the soil profile. In the lab, students measure the particle size distribution of their sand samples, map the whole dune field from aerial photographs and a DEM, and estimate paleo-wind speed and direction. They then compare these data with modern wind data (available from the web) to answer the question of .just how different conditions were when the dune field was deposited Uses online and/or real-time data Addresses student fear of quantitative aspect and/or inadequate quantitative skills Uses geomorphology to solve problems in other fields
(Note: this resource was added to OER Commons as part of a batch upload of over 2,200 records. If you notice an issue with the quality of the metadata, please let us know by using the 'report' button and we will flag it for consideration.)
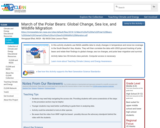
In this activity students use NASA satellite data to study changes in …
In this activity students use NASA satellite data to study changes in temperature and snow-ice coverage in the South Beaufort Sea, Alaska. They will then correlate the data with USGS ground tracking of polar bears and relate their findings to global change, sea ice changes, and polar bear migration and survival.
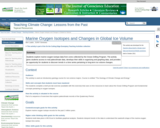
Students explore paleoclimate of the Quaternary Period by working with marine oxygen-isotope …
Students explore paleoclimate of the Quaternary Period by working with marine oxygen-isotope data from Ocean Drilling Program (ODP) core 677.
(Note: this resource was added to OER Commons as part of a batch upload of over 2,200 records. If you notice an issue with the quality of the metadata, please let us know by using the 'report' button and we will flag it for consideration.)
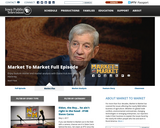
Market to Market is a part of the Iowa Public Television. The …
Market to Market is a part of the Iowa Public Television. The website includes videos of feature stories and market analysis by analyst Ted Seifried. In addition, there is Market to Market in the classroom where there are videos on business, technology and science of agriculture.
In this JAVA-based interactive modeling activity, students are introduced to the concepts …
In this JAVA-based interactive modeling activity, students are introduced to the concepts of mass balance, flow rates, and equilibrium using a simple water bucket model. Students can vary flow rate into the bucket, initial water level in the bucket, and residence time of water in the bucket. After running the model, the bucket's water level as a function of time is presented graphically and in tabular form.
SYNOPSIS: In this lesson, students use geometry to investigate the question "How …
SYNOPSIS: In this lesson, students use geometry to investigate the question "How much would sea levels rise if Antarctica melted?"
SCIENTIST NOTES: This lesson explores calculating the amount of sea level rise from melting the Antarctic Ice Sheet. Students see a real-world application of geometry tied to an important consequence of climate change. All materials have been fact-checked, and the lesson is credible for teaching. Considerations not mentioned in this lesson plan include the impact that the Greenland Ice Sheet would be simultaneously contributing to sea level rise, and that half of the current sea level rise is due to the thermal expansion of water.
POSITIVES: -Students see a real-world application of geometry tied to an important consequence of climate change. -Students practice volume and surface area formulas. -Teacher answer key is included.
ADDITIONAL PREREQUISITES: -Teacher needs to acquire some ice for the Inquire section. -Students should have a general knowledge of climate change and sea level rise. -Students should be familiar with the concepts of volume and surface area. -Students should be familiar with imperial and metric units.
DIFFERENTIATION: -Higher-level classes can work out the steps of the problems independently, while lower-level classes can follow the steps on the Student Document and Teacher Slideshow from the beginning. -The teacher can select one unit of measurement by editing the Student Document to use only meters and kilometers or to use only feet and miles. -The teacher can use occasional check-ins. For example, the teacher could stop the class after Step 1 in the Investigate section. This would help make sure all groups have similar answers and are off to a good start with the problem. -The teacher can select one resource in the Inspire section and explore the resource as a class instead of having the students explore the resources independently.
In this activity, students use datasets from both the Northern and Southern …
In this activity, students use datasets from both the Northern and Southern hemispheres to observe seasonal and hemispheric differences in changes to atmospheric C02 release and uptake over time.
Every German consumes an average of nearly 90 kg of meat every …
Every German consumes an average of nearly 90 kg of meat every year. This is way too much and problematic in many ways. Industrialized production of meat is unsustainable in many ways, it affects: Land consumption, food security, climate change, animal rights, pollution and health.
But what exactly are the problems of industrial meat production? What are the global implications? And what can be done about?
Realization: edeos- digital education http://www.edeos.org/en
Lessons teach core knowledge about the science of climate change, explore conflicting …
Lessons teach core knowledge about the science of climate change, explore conflicting views, and integrate critical thinking skills. Students will apply knowledge of climate change to a rigorous analysis of media messages through asking and answering questions about accuracy, currency, credibility, sourcing, and bias. Lessons address basic climate science, the causes of climate change, scientific debate and disinformation, the consequences of global warming, the precautionary principle, carbon footprints, moral choices, and the history of global warming in media, science, and politics.
This kit explores how sustainability within the Finger Lakes region of New …
This kit explores how sustainability within the Finger Lakes region of New York has been presented in the media with a particular focus on issues related to food, water and agriculture. Each of the seven lessons integrates media literacy and critical thinking with key knowledge and concepts related to sustainability. This kit is a companion to the nineteen-lesson collection, Media Constructions of Sustainability: Food, Water and Agriculture.
This kit explores how sustainability has been presented in the media with …
This kit explores how sustainability has been presented in the media with a particular focus on issues related to food, water and agriculture. Each of the 19 lessons integrates media literacy and critical thinking into lessons about different aspect of sustainability. Constant themes throughout the kit include social justice, climate change, energy, economics and unintended consequences.
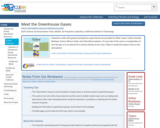
Interactive cards with gasses portrayed as super heroes are provided for Water …
Interactive cards with gasses portrayed as super heroes are provided for Water Vapor, Carbon Dioxide, Methane, Ozone, Nitrous Oxide, and Chlorofluorocarbons. On one side of the card is an explanation of how the gas is in its natural form and by clicking on the card, it flips to reveal the impact it has on the atmosphere.
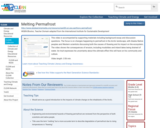
This video is accompanied by supporting materials including background essay and discussion …
This video is accompanied by supporting materials including background essay and discussion questions. The focus is on changes happening to permafrost in the Arctic landscape, with Alaska Native peoples and Western scientists discussing both the causes of thawing and its impact on the ecosystem. The video shows the consequences of erosion, including mudslides and inland lakes being drained of water. An Inuit expresses his uncertainty about the ultimate effect this will have on his community and culture.
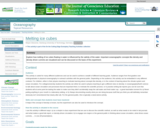
Explore how melting of ice cubes floating in water is influenced by …
Explore how melting of ice cubes floating in water is influenced by the salinity of the water. Important oceanographic concepts like density and density driven currents are visualized and can be discussed on the basis of this experiment.
(Note: this resource was added to OER Commons as part of a batch upload of over 2,200 records. If you notice an issue with the quality of the metadata, please let us know by using the 'report' button and we will flag it for consideration.)
No restrictions on your remixing, redistributing, or making derivative works. Give credit to the author, as required.
Your remixing, redistributing, or making derivatives works comes with some restrictions, including how it is shared.
Your redistributing comes with some restrictions. Do not remix or make derivative works.
Most restrictive license type. Prohibits most uses, sharing, and any changes.
Copyrighted materials, available under Fair Use and the TEACH Act for US-based educators, or other custom arrangements. Go to the resource provider to see their individual restrictions.