Students are given colored sand and a plexiglas box with a sliding …
Students are given colored sand and a plexiglas box with a sliding base. They make relatively thin, flat layers of sand (each layer has its own color)completely covering the base of the boxes then they move the base in one direction forcing the sand to pile up against the backstop side of the box. Then they measure the topography, make a topo map and construct cross sections. Has minimal/no quantitative component
You are an employee of Green Valley Dairy and your job is …
You are an employee of Green Valley Dairy and your job is to determine the mass of the company’s corn silage pile. Your boss knows that this pile is the limiting factor as to whether or not he can add animals to the herd. He is contemplating adding 500 head of cattle and needs to make sure there is enough feed in storage before they make the expansion...don’t mess up your measurements and calculations, as this is pivotal information.
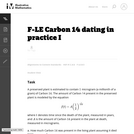
In the task "Carbon 14 Dating'' the amount of Carbon 14 in …
In the task "Carbon 14 Dating'' the amount of Carbon 14 in a preserved plant is studied as time passes after the plant has died. In practice, however, scientists wish to determine when the plant died and, as this task shows, this is not possible with a simple measurement of the amount of Carbon 14 remaining in the preserved plant. The equation for the amount of Carbon 14 remaining in the preserved plant is in many ways simpler here, using 12 as a base.
The author examines affective domain assessment, which focuses on evaluating individuals' attitudes, …
The author examines affective domain assessment, which focuses on evaluating individuals' attitudes, values, beliefs, and emotions related to a particular subject or domain. This type of assessment aims to measure the affective aspects of learning, such as motivation, engagement, and empathy. The author may discuss methods for assessing the affective domain, such as surveys, interviews, or self-assessments, and highlight the importance of considering learners' emotions and attitudes in the educational process.AFFECTIVE_DOMAIN_ASSESSMENT.docx
This quick guide will help you to hone your online content with …
This quick guide will help you to hone your online content with tips you can easily add to your lecturing. Our video, Writing for MOOCs (massive open online courses), is useful for any asynchronous online course. All of the course content can be implemented with a plus-one approach. Make one change at a time to your course writing and measure the difference it makes for your students!
Calculus is a year-long course that is comparable to calculus courses at …
Calculus is a year-long course that is comparable to calculus courses at the college or university level. In this course, the technological tools required for exploring, learning, and communicating calculus concepts include Microsoft Word with Microsoft Equation (or its equivalent) for typing math assignments, an approved graphing calculator (see a list of acceptable calculators at College Board AP Central) for the AP Calculus exam, and some type of grapher for creating graphs online such as Graphmatica (Windows) or Grapher (MAC) or an online graphing utility of your choice.
We may be leaving out information or disregarding it because it doesn't …
We may be leaving out information or disregarding it because it doesn't conform with our own beliefs. Students will learn about confirmation bias, different perspectives and how to avoid confirmation bias. This lesson is part of a media unit curated at our Digital Citizenship website, "Who Am I Online?".
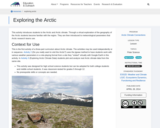
This activity introduces students to the Arctic and Arctic climate. Through a …
This activity introduces students to the Arctic and Arctic climate. Through a virtual exploration of the geography of the Arctic students become familiar with the region. They are then introduced to meteorological parameters that Arctic research teams use.
Move the sun, earth, moon and space station to see how it …
Move the sun, earth, moon and space station to see how it affects their gravitational forces and orbital paths. Visualize the sizes and distances between different heavenly bodies, and turn off gravity to see what would happen without it!
This part of the Student Observation Network allows you to make observations …
This part of the Student Observation Network allows you to make observations to answer the question, "Have auroras been seen within the last 24 hours due to a solar storm?"
The Student Observation Network provides guided inquiry. While participating in the Auroral Friends program your students may think of other questions that they wish to investigate. For instance, they may wish to know; "What causes the aurora?", "What affect does a solar storm have on aurora?", and "What conditions enhance auroras?". These open inquiries may reveal to them that coronal holes may energize auroras even when solar storms have not occurred.
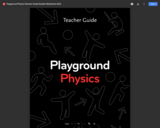
Playground Physics is an iPad and Progressive Web application (app) developed by …
Playground Physics is an iPad and Progressive Web application (app) developed by the New York Hall of Science. The app is accompanied by a supplemental Teacher Guide for middle school teachers. The Playground Physics curriculum is a six-week supplemental physics curriculum, designed to be used alongside any existing science curricula in the middle grades. It includes a teacher guide and student work, and maps to the NGSS and NYSSLS. The curriculum is focused around three different units which each explore a major concept in physics (motion, force and energy) through a specific type of physical play (catching a ball, jumping, swinging).
Playground Physics is particularly well suited to supporting diverse learners because it leverages students’ abilities to playfully ask and answer their own questions to connect academic content to what they notice, describe and analyze about their own individual actions. Additionally, the multimodal nature of the program, which uses videos and images as well as kinesthetic exploration to build understanding, is less text-dependent than more traditional physics instructional materials.
This guide walks you through the Checkology virtual classroom for grades 6-12 …
This guide walks you through the Checkology virtual classroom for grades 6-12 from the News Literacy Project. Students can move at their own pace through a wide variety of lessons that mostly focus on journalism and news literacy, but also cover misinformation, conspiracy theories, and other relevant topics.The lessons include videos of journalists and other experts, plus visually engaging interactive activities.
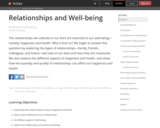
The relationships we cultivate in our lives are essential to our well-being—namely, …
The relationships we cultivate in our lives are essential to our well-being—namely, happiness and health. Why is that so? We begin to answer this question by exploring the types of relationships—family, friends, colleagues, and lovers—we have in our lives and how they are measured. We also explore the different aspects of happiness and health, and show how the quantity and quality of relationships can affect our happiness and health.
This lesson is a series of videos that cover Cold War fears …
This lesson is a series of videos that cover Cold War fears of the 1940s and 50s. It describers how the American Public were given measures to protect themselves against and invasion or an atomic attack. The lesson also has the student to view several videos on the domestic policies of the United states and a general overview of Cold war policies. Students will have to interpret point of view and argumentation from both sides of the political spectrum.
The author examines affective domain assessment, which focuses on evaluating individuals' attitudes, …
The author examines affective domain assessment, which focuses on evaluating individuals' attitudes, values, beliefs, and emotions related to a particular subject or domain. This type of assessment aims to measure the affective aspects of learning, such as motivation, engagement, and empathy. The author may discuss methods for assessing the affective domain, such as surveys, interviews, or self-assessments, and highlight the importance of considering learners' emotions and attitudes in the educational process.AFFECTIVE-ASSESSMENT.docx
The measurable goal and curricular aim of this lesson are for students …
The measurable goal and curricular aim of this lesson are for students to be able to fluently retrieve words in spelling patterns, and correctly spell both irregularly-spelled grade-appropriate words and words with vowel and consonant-blend patterns. The three activities in this lesson plan enables students to use the knowledge they have learned in class to complete. Students have an individual assesment at the end to write their own story incorporating the concepts from this lesson.
The primary activity described here is measurement of sub-surface water properties in …
The primary activity described here is measurement of sub-surface water properties in a local pond (e.g., temperature and dissolved oxygen). This activity combines concepts and skills from Geology, Biology and Chemistry.
(Note: this resource was added to OER Commons as part of a batch upload of over 2,200 records. If you notice an issue with the quality of the metadata, please let us know by using the 'report' button and we will flag it for consideration.)
This module uses existing publications from the USGS and the Army Corps …
This module uses existing publications from the USGS and the Army Corps of Engineers regarding flooding affects and classifications. The users are guided to basic overviews provided by those agencies can understand flooding and flooding concepts. The module also direct students to the 'real-time' data collected by the National Oceanic and Atmospheric Association in conjunction with the USGS so they can view graphs showing the relation between rainfall, river stage and flow for the Aberjona River. The NOAA and USGS databases can provide the user with real-time as well as historic data to track flood waves and establish base flows. This data was key to the trial in defining what amount of groundwater was derived from the Aberjona River.
(Note: this resource was added to OER Commons as part of a batch upload of over 2,200 records. If you notice an issue with the quality of the metadata, please let us know by using the 'report' button and we will flag it for consideration.)
Visualizing Energy is an open access, interdisciplinary science communication project that aims …
Visualizing Energy is an open access, interdisciplinary science communication project that aims to increase actionable knowledge about a sustainable and just energy transition. It uses engaging visualizations coupled with accessible data stories to communicate in clear, concise, jargon-free language. It is highly interdisciplinary and uses energy as an organizing principle to reveal logical connections across disciplines. Visualizing Energy knits data analysis, visualizations, and the written word into stories that promote critical thinking and communication. Its initial focus is on three interconnected areas: the connection between energy and human well-being; the history of energy transitions; and equity issues surrounding energy transitions (energy justice, energy burden, energy poverty, energy insecurity).
The project co-leaders are Cutler J. Cleveland, Professor of Earth and Environment, and Heather Clifford, data scientist in the Boston University Institute for Global Sustainability.
This short video discusses where carbon dioxide, the gas that is mainly …
This short video discusses where carbon dioxide, the gas that is mainly responsible for warming up our planet and changing the climate, comes from. It discusses how the rise in atmospheric carbon dioxide comes directly from the burning of fossil fuels and indirectly from the human need for energy.
No restrictions on your remixing, redistributing, or making derivative works. Give credit to the author, as required.
Your remixing, redistributing, or making derivatives works comes with some restrictions, including how it is shared.
Your redistributing comes with some restrictions. Do not remix or make derivative works.
Most restrictive license type. Prohibits most uses, sharing, and any changes.
Copyrighted materials, available under Fair Use and the TEACH Act for US-based educators, or other custom arrangements. Go to the resource provider to see their individual restrictions.