Description here. (Note: this resource was added to OER Commons as part …
Description here.
(Note: this resource was added to OER Commons as part of a batch upload of over 2,200 records. If you notice an issue with the quality of the metadata, please let us know by using the 'report' button and we will flag it for consideration.)
This math problem determines the areas of simple and complex planar figures …
This math problem determines the areas of simple and complex planar figures using measurement of mass and proportional constructs. Materials are inexpensive or easily found (poster board, scissors, ruler, sharp pencil, right angle), but also requires use of an analytical balance (suggestions are provided for working with less precise weighing tools). This resource is from PUMAS - Practical Uses of Math and Science - a collection of brief examples created by scientists and engineers showing how math and science topics taught in K-12 classes have real world applications.
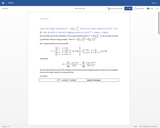
Derive Euler's formula from the Taylor series of the exponential function with …
Derive Euler's formula from the Taylor series of the exponential function with a complex argument. Derive the multi-angle trigonometric identities using Euler's formula. Derive the Binomial theorem by induction.
We express the exponential function of an imaginary variable in terms of …
We express the exponential function of an imaginary variable in terms of sine and cosine. The "complex exponentials" that result trace out a circle in the complex plane. Pointing to one of the positions in the complex plane, we obtain the identity exp(i pi) = -1.
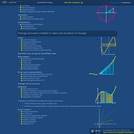
In the first video segment, we introduce Euler's number by considering the …
In the first video segment, we introduce Euler's number by considering the problem of interest compounded continuously. After we obtain the power-series representation for exp(x), we explore its properties, in the next four video segments, to convince ourselves that exp(x) is literally an exponential function, meaning a number, approximately 2.71828, taken to the power x. In the final two segments, we present the natural logarithm and demonstrate that it is the anti-derivative of 1/x.
This is a text-based STEM Inquiry, focusing on the mathematical standard of …
This is a text-based STEM Inquiry, focusing on the mathematical standard of making inferences and justifying conclusions while evaluating reports based on data. The unit culminates in students presenting their findings comparing local to national data regarding the relationships between educational attainment and financial earnings.
This lesson unit is intended to help teachers assess how well students …
This lesson unit is intended to help teachers assess how well students are able to solve problems involving area and volume, and in particular, to help you identify and assist students who have difficulties with the following: computing perimeters, areas and volumes using formulas; and finding the relationships between perimeters, areas, and volumes of shapes after scaling.
This lesson unit is intended to help teachers assess how well students …
This lesson unit is intended to help teachers assess how well students can: Understand the concepts of length and area; use the concept of area in proving why two areas are or are not equal; and construct their own examples and counterexamples to help justify or refute conjectures.
Web sources can be created by anyone and therefore are riskier in …
Web sources can be created by anyone and therefore are riskier in terms of their credibility and authority. This source offer some criteria by which webpages can be evaluated for authenticity.
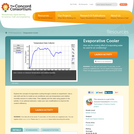
Explore the concept of evaporative cooling through a hands-on experiment. Use a …
Explore the concept of evaporative cooling through a hands-on experiment. Use a wet cloth and fan to model an air-conditioner and use temperature and relative humidity sensors to collect data. Then digitally plot the data using graphs in the activity. In an optional extension, make your own modifications to improve the cooler's efficiency.
This is a comprehensive math textbook for Grade 12. It can be …
This is a comprehensive math textbook for Grade 12. It can be downloaded, read on-line on a mobile phone, computer or iPad. Every chapter has links to on-line video lessons and explanations. Summary presentations at the end of each chapter offer an overview of the content covered, with key points highlighted for easy revision. Topics covered are: language of mathematics, logarithms, sequences and series, finance, factorising cubic polynomials, functions and graphs, differential calculus, linear programming, geometry, trigonometry, statistics, combinations and permutations. This book is based upon the original Free High School Science Text series.
Mathematical literacy textbook for grade 10. This resource includes an interactive online …
Mathematical literacy textbook for grade 10. This resource includes an interactive online textbook that can be read on personal computers, tablets, and mobile phones. Downloadable textbook and and teachers' guide also available in PDF format, in both English and Afrikaans
In the first video segment, we analyze the population dynamics for a …
In the first video segment, we analyze the population dynamics for a test-tube of cells that affect each others' likelihoods of replication when they collide. The particular example we use is a prisoner's dilemma, which has the almost paradoxical property that survival of the relatively most fit leads overall fitness to decrease. In the second video segment, we suggest that the population dynamics from the first segment can be related to an analysis that uses payoff matrices found in traditional game theory.
The evolution of ideas is often ignored in the teaching of statistics. …
The evolution of ideas is often ignored in the teaching of statistics. It is important to show students how definitions and formulas evolve. This activity describes a fairly straightforward activity of how measures of association can evolve.
This OER explores the operation of a Telescope. It combines a lesson …
This OER explores the operation of a Telescope. It combines a lesson on lenses with a lesson using a Galileoscope. It also includes resources for further exploration. It is a product of the OU Academy of the Lynx, developed in conjunction with the Galileo's World Exhibition at the University of Oklahoma.
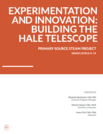
The primary sources in this project, drawn from the collections at the …
The primary sources in this project, drawn from the collections at the Rockefeller Archive Center, include correspondence and diagrams that document the process of fabricating what became a 200-inch Pyrex telescope mirror. These sources can be used to strengthen critical reading skills, to support inquiry-based learning exercises, and to expose students to the stories of trial and error that lie behind most scientific or engineering breakthroughs. Students are encouraged to annotate in the margins in order to support the development of document analysis and critical thinking skills. This project contains a suggested exercise that builds on the themes of the primary source documents.
Students apply what they know about light polarization and attenuation (learned in …
Students apply what they know about light polarization and attenuation (learned in the associated lesson) to design, build, test, refine and then advertise their prototypes for more effective sunglasses. Presented as a hypothetical design scenario, students act as engineers who are challenged to create improved sunglasses that reduce glare and lower light intensity while increasing eye protection from UVA and UVB radiation compared to an existing model of sunglasses—and make them as inexpensive as possible. They use a light meter to measure and compare light intensities through the commercial sunglasses and their prototype lenses. They consider the project requirements and constraints in their designs. They brainstorm and evaluate possible design ideas. They keep track of materials costs. They create and present advertisements to the class that promote the sunglasses benefits, using collected data to justify their claims. A grading rubric and reflection handout are provided.
Using the 5E instructional model, students discover the value of using color …
Using the 5E instructional model, students discover the value of using color maps to visualize data. The activity requires students to create a color map of the ozone hole from Dobson data values derived from the Aura satellite. Students then interpret that map and compare and evaluate different color scales. Note that this is the Spanish version of Exploring Color Maps: Using Stratospheric Ozone Data.
No restrictions on your remixing, redistributing, or making derivative works. Give credit to the author, as required.
Your remixing, redistributing, or making derivatives works comes with some restrictions, including how it is shared.
Your redistributing comes with some restrictions. Do not remix or make derivative works.
Most restrictive license type. Prohibits most uses, sharing, and any changes.
Copyrighted materials, available under Fair Use and the TEACH Act for US-based educators, or other custom arrangements. Go to the resource provider to see their individual restrictions.