The unit is focused on the examination of geography in terms of …
The unit is focused on the examination of geography in terms of “place.” Students dive into inquiry to answer the compelling questions, “Where are we?” and “Who are we?” Through these two questions students will understand where they live and where people around the world live. Students will also dive into the term “culture” and define it through many characteristics. Students will examine and reflect upon their own culture and research different cultures of North America.
Al-Bab is a portal website designed to introduce non-Arabs to Arab culture …
Al-Bab is a portal website designed to introduce non-Arabs to Arab culture by providing links to news sources, country profiles, articles, and a blog on Middle East current events. There are also specific links related to learning Arabic: dictionaries, language classes, textbooks, and other information pertaining to the study of Arabic. A free e-book, The Birth of Modern Yemen, is available for download.
This course covers works by major American novelists, beginning with the late …
This course covers works by major American novelists, beginning with the late 18th century and concluding with a contemporary novelist. The class places major emphasis on reading novels as literary texts, but attention is paid to historical, intellectual, and political contexts as well. The syllabus varies from term to term, but many of the following writers are represented: Rowson, Hawthorne, Melville, Twain, Wharton, James, and Toni Morrison. Previously taught topics include The American Revolution and Makeovers (i.e. adaptations and reinterpretation of novels traditionally considered as American "Classics"). May be repeated for credit with instructor's permission so long as the content differs.
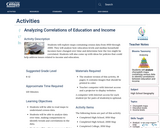
Students will explore maps containing census data from 1950 through 2000. They …
Students will explore maps containing census data from 1950 through 2000. They will analyze how education levels and median household incomes have changed over time and determine how the two might be correlated. Students will also come up with ideas for policies that could help address issues related to income and education.
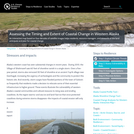
An interactive map based on four decades of satellite images helps residents, …
An interactive map based on four decades of satellite images helps residents, resource managers, and stewards of the land anticipate and plan for coastal change.
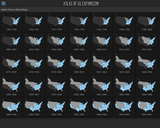
Blue Coral Atlas of US Expansion tells the geographic story of the …
Blue Coral Atlas of US Expansion tells the geographic story of the United States from the original thirteen colonies to today. View all the maps together in a single scroll or choose maps either individually or in series together for a closer look.
Blue Coral Atlas of US Expansion is fully responsive in the web browser for large and small devices in both horizontal and vertical orientations.
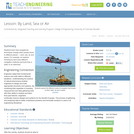
In this lesson, students learn that navigational techniques change when people travel …
In this lesson, students learn that navigational techniques change when people travel to different places land, sea, air and in space. For example, an explorer traveling by land uses different methods of navigation than a sailor or an astronaut.
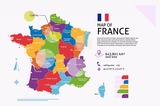
Cartography is the art and science of graphically representing a geographical area …
Cartography is the art and science of graphically representing a geographical area on a flat surface such as a map. For Indigenous peoples, cartography is more than just topography or mapping locations. For many Indigenous communities, it's about values, culture and traditional understandings.
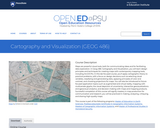
Maps capture the power of place. A well-designed map can stoke our …
Maps capture the power of place. A well-designed map can stoke our imagination, helping us to understand how a place looks or feels. Maps serve two roles. First, maps facilitate visual communication where knowns are presented to map readers. Second, maps permit visual thinking where insights into patterns and trends in spatial data are explored. In GEOG 486, Cartography & Visualization, you will learn and apply cartographic theory creating appropriately designed maps. You will learn how to associate the visual variables to symbolize types of spatial data. This process creates an appropriate visual hierarchy that conveys an informational hierarchy about the underlying message. Thus, techniques in map design will be applied to produce, evaluate, and critique reference and thematic maps.
This site features detailed battle maps made by Major Jedediah Hotchkiss for …
This site features detailed battle maps made by Major Jedediah Hotchkiss for General Lee and General Sherman, and maps taken from diaries, scrapbooks, and manuscripts -- all available for the first time in one place. An essay, History of Mapping the Civil War, looks at Union maps, Confederate maps, battlefield maps, commercial maps, and others.
This online activity demonstrates how simple it is to use key tools …
This online activity demonstrates how simple it is to use key tools in GeoFRED to focus on regional economic growth and development. The activity examines U.S. unemployment data at the county level to explore how employment was affected by the energy boom around the time of the Great Recession.
Iowa Heritage Digital Collections is a resource for students, educators, historians, genealogists, …
Iowa Heritage Digital Collections is a resource for students, educators, historians, genealogists, and anyone else interested in the people, places and institutions of Iowa. The site provides free access to digital collections from a variety of Iowa cultural institutions.
This website is a collection of Iowa History resources for educators, teachers, historians, and anyone interested in Iowa and its people, culture and places. It provides free access to digital collections from Iowa cultural institutions
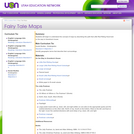
Students will begin to understand the concept of maps by describing the …
Students will begin to understand the concept of maps by describing the path that Little Red Riding Hood took on the way to Grandma's house. Main Curriculum Tie: Social Studies - Kindergarten, Standard 3 Objective 1, Identify geographic terms that describe their surroundings. Many fairy tales and nursery rhymes take the characters on a path through the rhyme/story. In this lesson, we will be making up maps for the characters to follow. In the first activity, the class will be recreating a map of the path that Little Red Riding Hood takes to Grandma’s house. The students will be exploring basic map directions and characteristics.
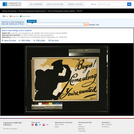
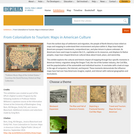
From the earliest days of settlement and migration, the people of North …
From the earliest days of settlement and migration, the people of North America have relied on maps and mapping to understand their environment and place within it. Maps have helped Americans prospect investments, comprehend war, and plan leisure in places unknown. As Americans have used maps to explore the U.S., capitalize on its resources, and displace its Native peoples, maps have shaped American cultural ideas about travel, place, and ownership. This exhibit explores the cultural and historic impact of mapping through four specific moments in American history: migration along the Oregon Trail, the rise of the lumber industry, the Civil War, and the popularization of the automobile and individual tourism. It concludes with a look at maps in the age of computers, the Internet, and beyond. These moments demonstrate the influence maps have had over how Americans imagine, exploit, and interact with national geographies and local places. This exhibition was created as part of the DPLAs Digital Curation Program by the following students in Professor Helene Williams's capstone course at the Information School at the University of Washington: Greg Bem, Kili Bergau, Emily Felt, and Jessica Blanchard. Additional revisions and selections made by Greg Bem.
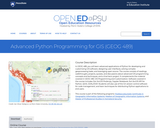
In GEOG 489, you will learn advanced applications of Python for developing …
In GEOG 489, you will learn advanced applications of Python for developing and customizing GIS software, designing user interfaces, solving complex geoprocessing tasks, and leveraging open source. The course consists of readings, walkthroughs, projects, quizzes, and discussions about advanced GIS programming concepts and techniques, and a final term project. It complements the material covered in GEOG 485: GIS Programming and Customization. Software covered in the course includes: Esri ArcGIS Pro/arcpy, Jupyter Notebook, Esri ArcGIS API for Python, QGIS, GDAL/OGR. Students will also use of the Git version control software for code management, and learn techniques for distributing Python applications to end users.
No restrictions on your remixing, redistributing, or making derivative works. Give credit to the author, as required.
Your remixing, redistributing, or making derivatives works comes with some restrictions, including how it is shared.
Your redistributing comes with some restrictions. Do not remix or make derivative works.
Most restrictive license type. Prohibits most uses, sharing, and any changes.
Copyrighted materials, available under Fair Use and the TEACH Act for US-based educators, or other custom arrangements. Go to the resource provider to see their individual restrictions.