Statistics is the study of variability. Students who understand statistics need to …
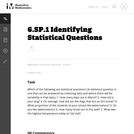
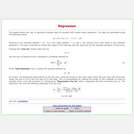
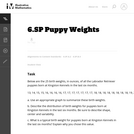
Statistics is the study of variability. Students who understand statistics need to be able to identify and pose questions that can be answered by data that vary. The purpose of this task is to provide questions related to a particular context (a jar of buttons) so that students can identify which are statistical questions. The task also provides students with an opportunity to write a statistical question that pertains to the context.
This is a task from the Illustrative Mathematics website that is one …
This is a task from the Illustrative Mathematics website that is one part of a complete illustration of the standard to which it is aligned. Each task has at least one solution and some commentary that addresses important aspects of the task and its potential use.
Students will explore the overarching question, is the internet trustworthy?, while expanding …
Students will explore the overarching question, is the internet trustworthy?, while expanding their knowledge of statistics and comparing data sets. They will compare two data sets as well as determine the accuracy or bias of data representations shown on the internet. Students will then have the opportunity to apply their knowledge while creating their own visual representations for data they personally collected regarding the trustworthiness of the internet. The module concludes with a peer showcase and the post-assessment.
Students write statistical questions that can be used to find information about …
Students write statistical questions that can be used to find information about a typical sixth grade student. Then, the class works together to informally plan how to find the typical arm span of a student in their class.Key ConceptsStatistical thinking, in large part, must deal with variability; statistical problem solving and decision making depend on understanding, explaining, and quantifying the variability in the data.“How tall is a sixth grader?” is a statistical question because all sixth graders are not the same height—there is variability.Goals and Learning ObjectivesUnderstand what a statistical question is.Realize there is variability in data and understand why.Describe informally the range, median, and mode of a set of data.
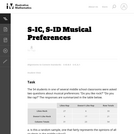
Students apply pre-requisite statistics knowledge and concepts learned in an associated lesson …
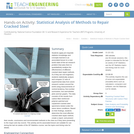
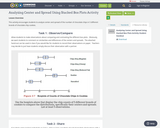
Students apply pre-requisite statistics knowledge and concepts learned in an associated lesson to a real-world state-of-the-art research problem that asks them to quantitatively analyze the effectiveness of different cracked steel repair methods. As if they are civil engineers, students statistically analyze and compare 12 sets of experimental data from seven research centers around the world using measurements of central tendency, five-number summaries, box-and-whisker plots and bar graphs. The data consists of the results from carbon-fiber-reinforced polymer patched and unpatched cracked steel specimens tested under the same stress conditions. Based on their findings, students determine the most effective cracked steel repair method, create a report, and present their results, conclusions and recommended methods to the class as if they were presenting to the mayor and city council. This activity and its associated lesson are suitable for use during the last six weeks of the AP Statistics course; see the topics and timing note for details.
This lesson unit is intended to help teachers assess how well students …
This lesson unit is intended to help teachers assess how well students are able to: interpret data and evaluate statistical summaries; and critique someone elseŐs interpretations of data and evaluations of statistical summaries. The lesson also introduces students to the dangers of misapplying simple statistics in real-world contexts, and illustrates some of the common abuses of statistics and charts found in the media.
This is a task from the Illustrative Mathematics website that is one …
This is a task from the Illustrative Mathematics website that is one part of a complete illustration of the standard to which it is aligned. Each task has at least one solution and some commentary that addresses important asects of the task and its potential use. Here are the first few lines of the commentary for this task: Which of the following are statistical questions? (A statistical question is one that can be answered by collecting data and where there will be variab...
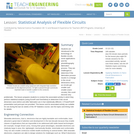
Students are introduced to the technology of flexible circuits, some applications and …
Students are introduced to the technology of flexible circuits, some applications and the photolithography fabrication process. They are challenged to determine if the fabrication process results in a change in the circuit dimensions since, as circuits get smaller and smaller (nano-circuits), this could become very problematic. The lesson prepares students to conduct the associated activity in which they perform statistical analysis (using Excel® and GeoGebra) to determine if the circuit dimension sizes before and after fabrication are in fact statistically different. A PowerPoint® presentation and post-quiz are provided. This lesson and its associated activity are suitable for use during the last six weeks of the AP Statistics course; see the topics and timing note for details.
In this module, students reconnect with and deepen their understanding of statistics …
In this module, students reconnect with and deepen their understanding of statistics and probability concepts first introduced in Grades 6, 7, and 8. Students develop a set of tools for understanding and interpreting variability in data, and begin to make more informed decisions from data. They work with data distributions of various shapes, centers, and spreads. Students build on their experience with bivariate quantitative data from Grade 8. This module sets the stage for more extensive work with sampling and inference in later grades.
Find the rest of the EngageNY Mathematics resources at https://archive.org/details/engageny-mathematics.
In this statistics project, students will begin by sampling a population to …
In this statistics project, students will begin by sampling a population to answer their own designed question. They will then use their sample to graph, find the mean and standard deviation, and illustrate their understanding of normal distribution. They will then manipulate their data to make it "normal" and, after finding new samples, analyze the associated z-score and percents of that new data.
Measuring the dimensions of nano-circuits requires an expensive, high-resolution microscope with integrated …
Measuring the dimensions of nano-circuits requires an expensive, high-resolution microscope with integrated video camera and a computer with sophisticated imaging software, but in this activity, students measure nano-circuits using a typical classroom computer and (the free-to-download) GeoGebra geometry software. Inserting (provided) circuit pictures from a high-resolution microscope as backgrounds in GeoGebra's graphing window, students use the application's tools to measure lengths and widths of circuit elements. To simplify the conversion from the on-screen units to the real circuits' units and the manipulation of the pictures, a GeoGebra measuring interface is provided. Students export their data from GeoGebra to Microsoft® Excel® for graphing and analysis. They test the statistical significance of the difference in circuit dimensions, as well as obtain a correlation between average changes in original vs. printed circuits' widths. This activity and its associated lesson are suitable for use during the last six weeks of the AP Statistics course; see the topics and timing note below for details.
This is a text-based STEM Inquiry, focusing on the mathematical standard of …
This is a text-based STEM Inquiry, focusing on the mathematical standard of making inferences and justifying conclusions while evaluating reports based on data. The unit culminates in students presenting their findings comparing local to national data regarding the relationships between educational attainment and financial earnings.
This applet from Statistical Java allows the user to generate bivariate data …
This applet from Statistical Java allows the user to generate bivariate data for analysis with simple linear regression. The page describes the equations used to generate the data and estimate the regression lines.
The students will use ACC basketball statistics to practice the process of …
The students will use ACC basketball statistics to practice the process of converting fractions to decimals then to percents and will learn how to create and edit a spreadsheet. They will then use this spreadsheet to analyze their data. This unit is done during the basketball season which takes approximately 15 weeks from the middle of November to the middle of March. Teachers must have Clarisworks to open the sample spreadsheet in the lesson, but may recreate it in another spreadsheet program.
This task introduces the fundamental statistical ideas of using data summaries (statistics) …
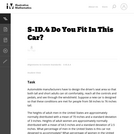
This task introduces the fundamental statistical ideas of using data summaries (statistics) from random samples to draw inferences (reasoned conclusions) about population characteristics (parameters). In the task built around an election poll scenario, the population is the entire seventh grade class, the unknown characteristic (parameter) of interest is the proportion of the class members voting for a specific candidate, and the sample summary (statistic) is the observed proportion of voters favoring the candidate in a random sample of class members.
This task introduces the fundamental statistical ideas of using data summaries (statistics) …
This task introduces the fundamental statistical ideas of using data summaries (statistics) from random samples to draw inferences (reasoned conclusions) about population characteristics (parameters). In the task built around an election poll scenario, the population is the entire seventh grade class, the unknown characteristic (parameter) of interest is the proportion of the class members voting for a specific candidate, and the sample summary (statistic) is the observed proportion of voters favoring the candidate in a random sample of class members.
A full AP® Statistics curriculum that explores relevant data in social issues, …
A full AP® Statistics curriculum that explores relevant data in social issues, economics, medicine, sports, and more. The sequence works well in conjunction with the course CED and the most widely-used AP® Statistics textbooks.
Lesson OverviewStudents complete a card sort that requires them to match sets …
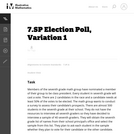
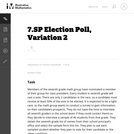
Lesson OverviewStudents complete a card sort that requires them to match sets of statistics with the corresponding line plots.Students match cards with simple line plots to the corresponding card with measures of center. Some cards include mode, mean, median, and range, and some have one or two measures missing. Students discuss how they determined which cards would match.Key ConceptsTo complete the card sort in this lesson efficiently, students must be able to relate statistical measures with line plots. If they start with the measures that are easy to see, they can narrow down the possible matches.The mode is the easiest measure to see immediately. It is simply the number with the tallest column of dots.The range can be found easily by subtracting the least value in the plot from the greatest.The median can be found fairly quickly by counting to the middle dot or by pairing dots on the ends until reaching the middle.The mean must be calculated by adding data values and dividing.Goals and Learning ObjectivesApply knowledge of measures of center and range to solve problems.Discuss and review strategy choices when problem solving.
This is a task from the Illustrative Mathematics website that is one …
This is a task from the Illustrative Mathematics website that is one part of a complete illustration of the standard to which it is aligned. Each task has at least one solution and some commentary that addresses important aspects of the task and its potential use.
This task examines, from a mathematical and statistical point of view, how …
This task examines, from a mathematical and statistical point of view, how scientists measure the age of organic materials by measuring the ratio of Carbon 14 to Carbon 12. The focus here is on the statistical nature of such dating. This task addresses a very important issue about precision in reporting and understanding statements in a realistic scientific context.
This is a task from the Illustrative Mathematics website that is one …
This is a task from the Illustrative Mathematics website that is one part of a complete illustration of the standard to which it is aligned. Each task has at least one solution and some commentary that addresses important aspects of the task and its potential use.
This resource aims to generate ideas and possibilities about how to advance …
This resource aims to generate ideas and possibilities about how to advance student understanding of logic in writing beyond the notion that logic is always a collection of data points or a reference to facts. Instead of reducing logic to numbers and statements, this source hopes to introduce students and teachers to the existential questions that are always involved in the logical appeals of a text: how do we know what we know and why does it matter?
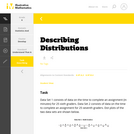
Distributions and Variability Type of Unit: Project Prior Knowledge Students should be …
Distributions and Variability
Type of Unit: Project
Prior Knowledge
Students should be able to:
Represent and interpret data using a line plot. Understand other visual representations of data.
Lesson Flow
Students begin the unit by discussing what constitutes a statistical question. In order to answer statistical questions, data must be gathered in a consistent and accurate manner and then analyzed using appropriate tools.
Students learn different tools for analyzing data, including:
Measures of center: mean (average), median, mode Measures of spread: mean absolute deviation, lower and upper extremes, lower and upper quartile, interquartile range Visual representations: line plot, box plot, histogram
These tools are compared and contrasted to better understand the benefits and limitations of each. Analyzing different data sets using these tools will develop an understanding for which ones are the most appropriate to interpret the given data.
To demonstrate their understanding of the concepts, students will work on a project for the duration of the unit. The project will involve identifying an appropriate statistical question, collecting data, analyzing data, and presenting the results. It will serve as the final assessment.
With your mouse, drag data points and their error bars, and watch …
With your mouse, drag data points and their error bars, and watch the best-fit polynomial curve update instantly. You choose the type of fit: linear, quadratic, cubic, or quartic. The reduced chi-square statistic shows you when the fit is good. Or you can try to find the best fit by manually adjusting fit parameters.
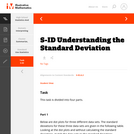
This task requires students to use the normal distribution as a model …
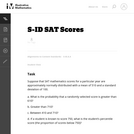
This task requires students to use the normal distribution as a model for a data distribution. Students must use given means and standard deviations to approximate population percentages. There are several ways (tables, graphing calculators, or statistical software) that students might calculate the required normal percentages. Depending on the method used, answers might vary somewhat from those shown in the solution.
n addition to providing a task that relates to other disciplines (history, …
n addition to providing a task that relates to other disciplines (history, civics, current events, etc.), this task is intended to demonstrate that a graph can summarize a distribution as well as provide useful information about specific observations.
This is an interdisciplinary lesson that incorporates tools learned in Algebra about …
This is an interdisciplinary lesson that incorporates tools learned in Algebra about analyzing data representations to apply to historical and literary purposes.
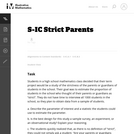
Students are introduced to the concept of sampling as a method of …
Students are introduced to the concept of sampling as a method of determining characteristics of a population. They consider how a sample can be random or biased, and think of methods for randomly sampling a population to ensure that it is representative.The idea of sampling is connected to probability; a relatively small set of data (a random sample/number of trials) can be used to generalize about a population (or determine probability). A larger sample (more trials) will give more confidence in the conclusions, but how large of a sample is needed?Students also discuss what random means and how to generate a random sample. Random samples are compared to biased samples and give insight into how statistics can be misleading (intentionally or otherwise).Key ConceptsRandom samples are related to probability. In probability, the number of trials is a sample used to generalize about the probability of an event. The results in probability are random if we are looking at equally likely outcomes. If a data sample is not random, the conclusions about the population will not reflect it.Terminology introduced in this lesson:population: the entire set of objects that can be considered when asking a statistical questionsample: a subset of a population; can be random, where each object in the population is equally likely to be in the sample, or biased, where not every object in the population is equally likely to be in the sampleGoals and Learning ObjectivesIntroduce sampling as a method to generalize about a population.Discuss the concept of a random sample versus a biased sample.Determine methods to generate random samples.Understand that biased samples are sometimes used to mislead.SWD: Some students with disabilities will benefit from a preview of the goals in this lesson. Students can highlight the critical features and/or concepts and will help them to pay close attention to salient information.
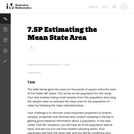
The task is designed to show that random samples produce distributions of …
The task is designed to show that random samples produce distributions of sample means that center at the population mean, and that the variation in the sample means will decrease noticeably as the sample size increases. Random sampling (like mixing names in a hat and drawing out a sample) is not a new idea to most students, although the terminology is likely to be new.
Students collect data to answer questions about a typical sixth grade student. …
Students collect data to answer questions about a typical sixth grade student. Students collect data about themselves, working in pairs to measure height, arm span, etc. Students discuss characteristics they would like to know about sixth grade students, adding these topics to a preset list. Data are collected and organized such that there is a class data set for each topic for future use. Students are asked to think about how this data could be represented and organized.Key ConceptsFor data to be useful, it must be collected in a consistent and accurate way. For example, for height data, students must agree on whether students should be measured with shoes on or off, and whether heights should be measured to the nearest inch, half inch, or centimeter.Goals and Learning ObjectivesGather data about sixth grade students.Consider how data are collected.
This exercise demonstrates that judgment (non-random) samples tend to be biased in …
This exercise demonstrates that judgment (non-random) samples tend to be biased in the sense that they produce samples that are not balanced with respect to the population characteristics of interest.
Students critique and improve their work on the Self Check from Lesson …
Students critique and improve their work on the Self Check from Lesson 13.Key ConceptsMeasures of spread (five-number summary) show characteristics of the data. It is possible to generate an appropriate data set with this information.Goals and Learning ObjectivesApply knowledge of statistics to solve problems.Identify the five-number summary, and understand measures of center and use their properties to solve problems.Track and review choice of strategy when problem solving.
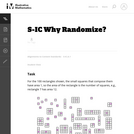
In this task students design a plan to conduct a random sample …
In this task students design a plan to conduct a random sample of the students in their school to estimate the proportion of students who think their parents are strict.
Students build on their existing air quality knowledge and a description of …
Students build on their existing air quality knowledge and a description of a data set to each develop a hypothesis around how and why air pollutants vary on a daily and seasonal basis. Then they are guided by a worksheet through an Excel-based analysis of the data. This includes entering formulas to calculate statistics and creating plots of the data. As students complete each phase of the analysis, reflection questions guide their understanding of what new information the analysis reveals. At activity end, students evaluate their original hypotheses and “put all of the pieces together.” The activity includes one carbon dioxide worksheet/data set and one ozone worksheet/data set; providing students and/or instructors with a content option. The activity also serves as a good standalone introduction to using Excel.
Every month we will give you a math/statistics brain teaser that lets …
Every month we will give you a math/statistics brain teaser that lets you test your knowledge with a fun problem.Many of the ideas in these Teasers come from thoughts formed by some of the great mathematical/statistical geniuses in history.
Students build a formal understanding of probability, considering complex events such as …
Students build a formal understanding of probability, considering complex events such as unions, intersections, and complements as well as the concept of independence and conditional probability. The idea of using a smooth curve to model a data distribution is introduced along with using tables and technology to find areas under a normal curve. Students make inferences and justify conclusions from sample surveys, experiments, and observational studies. Data is used from random samples to estimate a population mean or proportion. Students calculate margin of error and interpret it in context. Given data from a statistical experiment, students use simulation to create a randomization distribution and use it to determine if there is a significant difference between two treatments.
Find the rest of the EngageNY Mathematics resources at https://archive.org/details/engageny-mathematics.
As the standards in statistics and probability unfold, students will not yet …
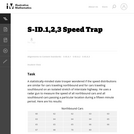
As the standards in statistics and probability unfold, students will not yet know the rules of probability for compound events. Thus, simulation is used to find an approximate answer to these questions. In fact, part b would be a challenge to students who do know the rules of probability, further illustrating the power of simulation to provide relatively easy approximate answers to wide-ranging problems.
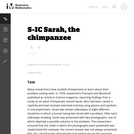
This problem could be used as an introductory lesson to introduce group …
This problem could be used as an introductory lesson to introduce group comparisons and to engage students in a question they may find amusing and interesting. More generally, the idea of the lesson could be used as a template for a project where students develop a questionnaire, sample students at their school and report on their findings.
This lesson unit is intended to help you assess how well students …
This lesson unit is intended to help you assess how well students are able to: Calculate the mean, median, mode, and range from a frequency chart; and to use a frequency chart to describe a possible data set, given information on the mean, median, mode, and range.
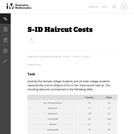
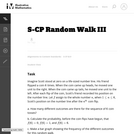
The goal of this task is twofold. For part (a) since we …
The goal of this task is twofold. For part (a) since we are not given how large each of the groups in the table are, the best we can do is to apply reasoning about ratios (in the form of percents) to give a range of possible answers. For part (b), the goal is to recognize a misuse of statistical reasoning.
The purpose of this task is to allow students to demonstrate an …
The purpose of this task is to allow students to demonstrate an ability to construct boxplots and to use boxplots as the basis for comparing distributions. The solution should directly compare the center, spread, and shape of the two distributions and comment on the high outlier in the northbound data set.
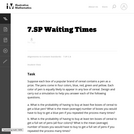
This task involves two aspects of statistical reasoning: providing a probabilistic model …
This task involves two aspects of statistical reasoning: providing a probabilistic model for the situation at hand, and defining a way to collect data to determine whether or not the observed data is reasonably likely to occur under the chosen model. When guessing between two choices, there is no reason to suspect that one outcome is more likely than the other. Thus, a model that assumes the two outcomes to be equally likely (such as flipping a coin) is appropriate.
The intent of clarifying statements is to provide additional guidance for educators …
The intent of clarifying statements is to provide additional guidance for educators to communicate the intent of the standard to support the future development of curricular resources and assessments aligned to the 2021 math standards. Clarifying statements can be in the form of succinct sentences or paragraphs that attend to one of four types of clarifications: (1) Student Experiences; (2) Examples; (3) Boundaries; and (4) Connection to Math Practices.
The purpose of this task is to have students complete normal distribution …
The purpose of this task is to have students complete normal distribution calculations and to use properties of normal distributions to draw conclusions. The task is designed to encourage students to communicate their findings in a narrative/report form in context Đ not just simply as a computed number.
Students will apply what they have learned in previous lessons to analyze …
Students will apply what they have learned in previous lessons to analyze and draw conclusions about a set of data. They will also justify their thinking based on what they know about the measures (e.g., I know the mean is a good number to use to describe what is typical because the range is narrow and so the MAD is low.).Students analyze one of the data sets about the characteristics of sixth grade students that was collected by the class in Lesson 2. Students construct line plots and calculate measures of center and spread in order to further their understanding of the characteristics of a typical sixth grade student.Key ConceptsNo new mathematical ideas are introduced in this lesson. Instead, students apply the skills they have acquired in previous lessons to analyze a data set for one attribute of a sixth grade student. Students make a line plot of the data and find the mean, median, range, MAD, and outliers. They use these results to determine a typical value for their data.Goals and Learning ObjectivesDescribe an attribute of a typical sixth grade student using line plots and measures of center (mean and median) and spread (range and MAD).Justify thinking about which measures are good descriptors of the data set.
This task provides a context to calculate discrete probabilities and represent them …
This task provides a context to calculate discrete probabilities and represent them on a bar graph. It could also be used to create a class activity where students gather, represent, and analyze data, running simulations of the random walk and recording and then displaying their results.
(Nota: Esta es una traducción de un recurso educativo abierto creado por …
(Nota: Esta es una traducción de un recurso educativo abierto creado por el Departamento de Educación del Estado de Nueva York (NYSED) como parte del proyecto "EngageNY" en 2013. Aunque el recurso real fue traducido por personas, la siguiente descripción se tradujo del inglés original usando Google Translate para ayudar a los usuarios potenciales a decidir si se adapta a sus necesidades y puede contener errores gramaticales o lingüísticos. La descripción original en inglés también se proporciona a continuación.)
En este módulo, los estudiantes reconectan y profundizan su comprensión de las estadísticas y los conceptos de probabilidad introducidos por primera vez en los grados 6, 7 y 8. Los estudiantes desarrollan un conjunto de herramientas para comprender e interpretar la variabilidad en los datos, y comienzan a tomar decisiones más informadas de los datos . Trabajan con distribuciones de datos de varias formas, centros y diferenciales. Los estudiantes se basan en su experiencia con datos cuantitativos bivariados del grado 8. Este módulo prepara el escenario para un trabajo más extenso con muestreo e inferencia en calificaciones posteriores.
Encuentre el resto de los recursos matemáticos de Engageny en https://archive.org/details/engageny-mathematics.
English Description: In this module, students reconnect with and deepen their understanding of statistics and probability concepts first introduced in Grades 6, 7, and 8. Students develop a set of tools for understanding and interpreting variability in data, and begin to make more informed decisions from data. They work with data distributions of various shapes, centers, and spreads. Students build on their experience with bivariate quantitative data from Grade 8. This module sets the stage for more extensive work with sampling and inference in later grades.
Find the rest of the EngageNY Mathematics resources at https://archive.org/details/engageny-mathematics.
A statistics lesson on describing and making claims from data representations, specifically …
A statistics lesson on describing and making claims from data representations, specifically linearly increasing data. Applies ideas of rate-of-change to develop writing a linear equation to fit the data, using the equation to interpolate and extrapolate additional information, and integrating the mathematical interpretation appropriately into a social sciences argument.
(Nota: Esta es una traducción de un recurso educativo abierto creado por …
(Nota: Esta es una traducción de un recurso educativo abierto creado por el Departamento de Educación del Estado de Nueva York (NYSED) como parte del proyecto "EngageNY" en 2013. Aunque el recurso real fue traducido por personas, la siguiente descripción se tradujo del inglés original usando Google Translate para ayudar a los usuarios potenciales a decidir si se adapta a sus necesidades y puede contener errores gramaticales o lingüísticos. La descripción original en inglés también se proporciona a continuación.)
Los estudiantes crean una comprensión formal de la probabilidad, considerando eventos complejos como sindicatos, intersecciones y complementos, así como el concepto de independencia y probabilidad condicional. La idea de usar una curva suave para modelar una distribución de datos se introduce junto con el uso de tablas y tecnología para encontrar áreas bajo una curva normal. Los estudiantes hacen inferencias y justifican conclusiones de encuestas de muestra, experimentos y estudios de observación. Los datos se usan de muestras aleatorias para estimar una media o proporción de población. Los estudiantes calculan el margen de error y lo interpretan en contexto. Dados los datos de un experimento estadístico, los estudiantes usan la simulación para crear una distribución de aleatorización y lo usan para determinar si hay una diferencia significativa entre dos tratamientos.
Encuentre el resto de los recursos matemáticos de Engageny en https://archive.org/details/engageny-mathematics.
English Description: Students build a formal understanding of probability, considering complex events such as unions, intersections, and complements as well as the concept of independence and conditional probability. The idea of using a smooth curve to model a data distribution is introduced along with using tables and technology to find areas under a normal curve. Students make inferences and justify conclusions from sample surveys, experiments, and observational studies. Data is used from random samples to estimate a population mean or proportion. Students calculate margin of error and interpret it in context. Given data from a statistical experiment, students use simulation to create a randomization distribution and use it to determine if there is a significant difference between two treatments.
Find the rest of the EngageNY Mathematics resources at https://archive.org/details/engageny-mathematics.
Students randomly select jelly beans (or other candy) that represent genes for …
Students randomly select jelly beans (or other candy) that represent genes for several human traits such as tongue-rolling ability and eye color. Then, working in pairs (preferably of mixed gender), students randomly choose new pairs of jelly beans from those corresponding to their own genotypes. The new pairs are placed on toothpicks to represent the chromosomes of the couple's offspring. Finally, students compare genotypes and phenotypes of parents and offspring for all the "couples" in the class. In particular, they look to see if there are cases where parents and offspring share the exact same genotype and/or phenotype, and consider how the results would differ if they repeated the simulation using more than four traits.
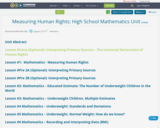
In this unit, students will read and interpret primary sources to address …
In this unit, students will read and interpret primary sources to address the question “How do we measure the attainment of human rights?” By exploring the Universal Declaration of Human Rights, the UN’s Guide to Indicators of Human Rights, and data about development indicators from multiple databases, students will unpack the complexities of using indicators to measure human rights.
Students use the Box Plot interactive, which allows them to create line …
Students use the Box Plot interactive, which allows them to create line plots and see the corresponding box plots. They use this tool to create data sets with box plots that satisfy given criteria.Students investigate how the box plot changes as the data points in the line plot are moved. Students can manipulate data points to change aspects of the box plot and to see how the line plot changes. Students create box plots that fit certain criteria.Key ConceptsThis lesson focuses on the connection between a data set and its box plot. It reinforces the idea that a box plot shows the spread of a data set, but not the individual data points.Students will observe the following similarities and differences between line plots and box plots:Line plots allow us to see and count individual values, while box plots do not.Line plots allow us to find the mean and the mode of a set of data, while box plots do not.Box plots are useful for very large data sets, while line plots are not.Box plots give us a better picture of how the values in a data set are distributed than line plots do, and they allow us to see measures of spread easily.Goals and Learning ObjectivesExperiment with different line plots to see the effect on the corresponding box plots.Create data sets with box plots that satisfy different criteria.Compare and contrast line plots and box plots.
No restrictions on your remixing, redistributing, or making derivative works. Give credit to the author, as required.
Your remixing, redistributing, or making derivatives works comes with some restrictions, including how it is shared.
Your redistributing comes with some restrictions. Do not remix or make derivative works.
Most restrictive license type. Prohibits most uses, sharing, and any changes.
Copyrighted materials, available under Fair Use and the TEACH Act for US-based educators, or other custom arrangements. Go to the resource provider to see their individual restrictions.