Updating search results...

Search Resources

969 Results

View
Selected filters:
  • Measurement and Data
Cartography
Conditional Remix & Share Permitted
CC BY-NC-SA
Rating
0.0 stars

In the first part of the exercise, students examine a variety of ArcMaps to work out what data sets and techniques were used and to develop a list of the characteristics of effective, attractive, and complete maps. In part 2, students explore a GIS tutorial of cartographic techniques. You might also be interested in our Full GIS course with links to all assignments.

Subject:
Education
Educational Technology
Mathematics
Measurement and Data
Material Type:
Activity/Lab
Provider:
Science Education Resource Center (SERC) at Carleton College
Provider Set:
Teach the Earth
Author:
Barb Tewksbury
Date Added:
01/20/2023
A Case Study: Geology, Remediation, Investigation at a RR Repair Shop Brownfield Site, St. Paul, Minnesota
Conditional Remix & Share Permitted
CC BY-NC-SA
Rating
0.0 stars

A case-study approach can be used to introduce students to the work that geologists do as environmental consultants. Data used by environmental consultants for a Brownfield site that is currently undergoing redevelopment in St. Paul, MN has been adapted for in-class study, either as a series of short exercises, or as part of a larger project.

(Note: this resource was added to OER Commons as part of a batch upload of over 2,200 records. If you notice an issue with the quality of the metadata, please let us know by using the 'report' button and we will flag it for consideration.)


Subject:
Chemistry
Mathematics
Measurement and Data
Physical Science
Statistics and Probability
Material Type:
Activity/Lab
Case Study
Provider:
Science Education Resource Center (SERC) at Carleton College
Provider Set:
Teach the Earth
Author:
Kate Kleiter
Date Added:
08/12/2019
Challenging Multi Step Money Problems
Conditional Remix & Share Permitted
CC BY-NC-SA
Rating
0.0 stars

This short video and interactive assessment activity is designed to teach fifth graders about challenging multi-step money problems.

Subject:
Mathematics
Measurement and Data
Material Type:
Assessment
Interactive
Lecture
Provider:
CK-12 Foundation
Provider Set:
CK-12 Elementary Math
Date Added:
03/06/2015
Checklists - Am I Finished?
Only Sharing Permitted
CC BY-NC-ND
Rating
0.0 stars

Checklist for students to use to ensure that all aspects of a constructed response math problem are answered and checked over before completion. 

Subject:
Algebra
Calculus
Computer Science
Geometry
History
Language, Grammar and Vocabulary
Languages
Mathematics
Measurement and Data
Physical Science
Physics
Trigonometry
Material Type:
Lesson Plan
Author:
Emily Horan
Date Added:
07/03/2019
Chemical Differentiation in the Palisades Sill
Conditional Remix & Share Permitted
CC BY-NC-SA
Rating
0.0 stars

The purpose of this assignment is for students to synthesize field observations, petrography, and whole-rock chemical analyses in order to investigate chemical differentiation processes in a basaltic magma chamber. The students first complete a petrography lab on both hand samples and thin sections that represent a complete stratigraphic section through sill at Fort Lee, NJ. I then provide them with major- and trace-element data and a table of distribution coefficients for common phases that would be crystallizing from basaltic magma. I then ask them to discuss the chemical differentiation of the sill by writing up a 1-2 page interpretative summary based on their petrographic observations and the chemical data.

(Note: this resource was added to OER Commons as part of a batch upload of over 2,200 records. If you notice an issue with the quality of the metadata, please let us know by using the 'report' button and we will flag it for consideration.)

Subject:
Biology
Chemistry
Life Science
Mathematics
Measurement and Data
Physical Science
Statistics and Probability
Material Type:
Activity/Lab
Data Set
Lesson Plan
Provider:
Science Education Resource Center (SERC) at Carleton College
Provider Set:
Teach the Earth
Author:
Matthew Gorring
Date Added:
08/06/2019
Cheyenne & Arapaho Tribes Activity Plan
Unrestricted Use
CC BY
Rating
0.0 stars

This activity was produced in conjunction with The Library of Congress and the TPS at Metropolitan State University of Denver. This activity will allow learners toinvestigate and explain how different groups of people were treated in the past, and the ways in which that treatment changed over timeidentify injustice in multiple formsidentify ways in which groups become marginalizedThis lesson leads students through several major events in the history of the Cheyenne & Arapaho tribes, and asks that they use primary source documents to describe the ways in which the treatment and perception of the tribes changed over time in southern Colorado.

Subject:
Cultural Geography
Ethnic Studies
Measurement and Data
U.S. History
World Cultures
Material Type:
Activity/Lab
Lesson Plan
Author:
Ashley Bogner
Date Added:
11/29/2022
Chicken Pox Math
Read the Fine Print
Educational Use
Rating
0.0 stars

In this lesson students will listen to a story of a boy with chicken pox and participate in a class discussion of chicken pox and what to do when you have a contagious disease. They will incorporate math by graphing who in the class has had the disease. They will draw chicken pox on an outline of a child, then practice mathematical concepts with the spots.

Subject:
Mathematics
Measurement and Data
Material Type:
Lesson Plan
Provider:
Utah Education Network
Date Added:
10/22/2013
Choosing the Correct Unit with Liters or Milliliters
Conditional Remix & Share Permitted
CC BY-NC-SA
Rating
0.0 stars

This short video and interactive assessment activity is designed to teach fifth graders about choosing the correct unit with liters or milliliters.

Subject:
Mathematics
Measurement and Data
Material Type:
Assessment
Interactive
Lecture
Provider:
CK-12 Foundation
Provider Set:
CK-12 Elementary Math
Date Added:
03/06/2015
Choropleth Map of the Happiest States
Conditional Remix & Share Permitted
CC BY-NC-SA
Rating
0.0 stars

GIS techniques, data sources, and other resources are so numerous and varied that, even if someone is doing GIS work regularly, it's common to say, "Now how did I do that last time?" or "Where did I get that data?". One of the main goals of my GIS course is to have students create a personal GIS portfolio that will be useful to them in the future, either for projects at Hamilton or in a job after graduation.
Portfolios must include, at a minimum, a spreadsheet of data sources and information about downloading and prepping data from each site; an annotated Word doc of useful web sites; a DVD collection of projects and data from the course; and an organized notebook that contains the items listed above plus all class handouts, exercises, and printouts of products.

What I stress in this assignment is that portfolios need to be more than collections of GIS stuff – they must be useful for the future. To make portfolios useful for the future, students have to give significant thought not only to organization but how they will be able to find information in their portfolios in the future and how they can build indexes, annotations, flow charts, etc. to make their portfolios more than a collection of pieces of paper in a binder.

Subject:
Education
Educational Technology
Mathematics
Measurement and Data
Material Type:
Activity/Lab
Provider:
Science Education Resource Center (SERC) at Carleton College
Provider Set:
Teach the Earth
Author:
Barb Tewksbury
Date Added:
01/20/2023
Circle Measurements Coloring Activity
Unrestricted Use
CC BY
Rating
0.0 stars

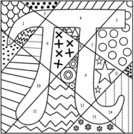
This resource is a 32 slide Desmos Activity. In the activity, students answer questions about calculating the raidus, diameter, circumference and area of given circles. Each correct answer allows them to advance to the Pi Coloring Page to add color to a section. 

Subject:
Geometry
Measurement and Data
Material Type:
Activity/Lab
Game
Homework/Assignment
Author:
Sara Scholes
Date Added:
11/18/2020
City Seminary 1: Quantitative Reasoning
Conditional Remix & Share Permitted
CC BY-NC-SA
Rating
0.0 stars

To participate in a data-intensive, twenty-first century society, you must be able to interpret, manipulate, and communicate quantitative information. Quantitative Reasoning (QR), also sometimes called quantitative literacy, is a habit of mind that enables you to make sense of the numerical aspects of real-life situations. By the end of this course, students are expected to be able to read, understand and create quantitative data using various analytical and graphical means.

Subject:
Measurement and Data
Material Type:
Lecture
Author:
Ashfaq Khan
Date Added:
05/23/2020
Climate Change and Atlantic Hurricanes: A GIS Inquiry
Conditional Remix & Share Permitted
CC BY-NC-SA
Rating
0.0 stars

Students are asked to make a general hypothesis about whether Atlantic hurricane have been changing over time in response to recent climate change. It is expected that at an introductory level with only the most basic background instruction, students will focus on numbers, locations, or intensities of hurricanes. Example hypotheses might be

The numbers of hurricanes are increasing (or decreasing)
Hurricanes are becoming more intense
Hurricanes are forming in new locations
Hurricane season is lengthening

They are then asked to develop more pointed questions that they can test. Some example questions for each hypothesis are given below:

Hypothesis 1 might lead to questions like "More hurricanes (or tropical storms) are forming each year" or "More hurricanes are striking land each year."
Hypothesis 2 might lead to questions such as "The maximum wind speed for hurricanes is increasing" or "The minimum barometric pressure is decreasing."
Hypothesis 3 might lead to questions like "Hurricanes are forming further north."
Hypothesis 4 might lead to questions such as "Hurricanes are forming earlier and later."

To answer these questions would require students to understand some background about hurricanes, like how many typically occur in the past (which leads to questions about data collection and observing hurricanes), how hurricane intensity is measured, or at what latitudes hurricanes typically form.

Then they are given a table or map data (derived from NOAA GIS data of hurricane tracks and intensity) to test their hypotheses.

The results of their inquiries and data collection will be shared with the class as parts of small groups initially, and will culminate as a small group presentation.

(Note: this resource was added to OER Commons as part of a batch upload of over 2,200 records. If you notice an issue with the quality of the metadata, please let us know by using the 'report' button and we will flag it for consideration.)

Subject:
Applied Science
Biology
Environmental Science
Life Science
Mathematics
Measurement and Data
Oceanography
Physical Science
Material Type:
Activity/Lab
Provider:
Science Education Resource Center (SERC) at Carleton College
Provider Set:
Teach the Earth
Author:
Chris Van de Ven
Date Added:
08/24/2019
Climate Change and Mammal Dispersal
Conditional Remix & Share Permitted
CC BY-NC-SA
Rating
0.0 stars

Students will learn how species shift along environmental gradients (temperature, precipitation, and vegetation) in response to climate change over the last 20,000 years, from the time of the Last Glacial Maximum through deglaciation and the Holocene. The activity involves making maps of species distribution using the Neotoma database. Students will develop skills in data analysis and interpretation over a two-to-four class arc.

(Note: this resource was added to OER Commons as part of a batch upload of over 2,200 records. If you notice an issue with the quality of the metadata, please let us know by using the 'report' button and we will flag it for consideration.)

Subject:
Applied Science
Biology
Environmental Science
History
Information Science
Life Science
Mathematics
Measurement and Data
Material Type:
Activity/Lab
Provider:
Science Education Resource Center (SERC) at Carleton College
Provider Set:
Teach the Earth
Author:
Suzanne Pilaar Birch
Date Added:
03/25/2021
Climate as Constraint
Conditional Remix & Share Permitted
CC BY-NC-SA
Rating
0.0 stars

Introduction:
Groundwater is key to Texas future and economy. The resource has long been a focus of legislative and economic interest. In the earliest days, the resource was viewed as 'occult and hidden.' That sense of mystery remains even as groundwater becomes more critical to the water resource picture for the state.
Since 1951, the state conducts regional water planning with the involvement of citizen stakeholders. Let's use your science-based knowledge of groundwater flow to see if you can find the right balance for both protecting and planning for groundwater use.
Our Case:
This week we will evaluate a historic court case from June 13, 1904. The case of East versus Texas Central Railroad Company is the Texas Supreme Ruling that provides the foundation for Texas groundwater law -- Rule of Capture.
In the appendix, you will find the following figures to help you determine whether or not Mr. East's well was impacted by the railroad company's pumping:

Platt map showing well locations and possible distances
Schematics of the well dimensions, along with simplified subsurface geology in the area.

In addition, you will be interested in knowing that the Geologic Atlas of Texas shows that the wells were likely completed in the Pawpaw Formation, which is a thick calcareous clay unit in the lower sections and cemented sand in the upper part. Lithologies in the area are reported to yield limited to moderate amounts of water in shallow wells. You can expect that the formation was an unconfined unit and assume that the East well is down-gradient from the Railroad well.
Assignment Part One:

1. Using the information from our last lecture, what do you think a reasonable transmissivity rate might be for the Pawpaw formation?

a. Estimate a transmissvity for a cemented sand unit.
b. Use this value as your first estimate in calculations to calculate the potential drawdown with Jacob's equation. This calculates the drawdown in an nonleaky artesian aquifer, sa, given the observed water table drawdowns.

sa = swt -- (s2st/2m)

c. Calculate swt using a correction equation.

Swt = m-(m2-2msa)1/2

Where m is the initial saturated thickness, which you may estimate at 30 ft.

2. How much water do you estimate that the railroad can extract before the well is impacted? Complete a diagram showing estimated drawdown (ft) on the y-axis and distances from the Railroad well (ft) using different transmissivity values and different distances. What do you discover about the case?
3. With your hydrogeologic analysis, do you believe that the East well was impacted by the railroad well? Can you explain how significant the impact may or may not have been?

Climate Considerations:
Is it possible that climate conditions could have impacted conditions in the well? Visit the Greenleaf website ([greenleaf.unl.edu/downloads/scPDSI.zip]) and access data for Palmer Drought Severity Indices. Looking at this data, complete the next questions.
Assignment Part 2:

4. Looking at the drought severity index maps of Texas from October 1900 to September 1902. What kind of implications might climate conditions have had on the groundwater conditions?
5. If climate conditions worsened, what do you think would happen to the wells?

Reference:
Mace, R.E., Ridgeway, C., and Sharp, J.M., 2004, Groundwater is no longer secret and occult - A historical and hydrogeologic analysis of the East case, 100 Years of Rule of Capture: From East to Groundwater Management, ed. Mullican, W.F. and Schwarz, S., Report 361, Texas Water Development Board, 63-86 pp.
Appendix -- support documents:
Figure 1 shows that Mr. East lived in Denison County, TX. The inset is a plan view map showing the potential locations of the wells in the town.
(in supporting documents)
Figure 2: Schematic of well dimensions and simplified geology.
(In supporting documents)

(Note: this resource was added to OER Commons as part of a batch upload of over 2,200 records. If you notice an issue with the quality of the metadata, please let us know by using the 'report' button and we will flag it for consideration.)
Subject:
Biology
Hydrology
Life Science
Mathematics
Measurement and Data
Physical Science
Statistics and Probability
Material Type:
Activity/Lab
Provider:
Science Education Resource Center (SERC) at Carleton College
Provider Set:
Teach the Earth
Author:
Suzanne Pierce
Date Added:
08/29/2019
Cognitive Facets for learning technical materials
Unrestricted Use
Public Domain
Rating
0.0 stars

Do you sometimes feel that you do not belong in this program, or some of its courses? The instructors assure you that you do belong! To help combat that sense of imposter syndrome that you might be feeling, let's explore the notion that your cognitive styles of learning are similar to your peers' learning styles.

You may already know that OSU and other universities have studied course materials and technical tools to make improvements that level the playing field amongst you and your peers. Programs such as Cognitive Style Heuristics and GenderMag/InclusiveMag study differences in how people problem-solve while learning new technical skills. The projects' core methods of finding bias bugs in software and materials is to apply personas that represent different sets of cognitive facets.

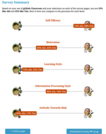
Explore the Facets and Personas by clicking on the tabs at the top, then analyze which persona fits you best, by taking the Survey.

Your selection data will disappear after refreshing the page, or closing the browser. It will not be saved and collected.

Subject:
Applied Science
Computer Science
Computing and Information
Education
Educational Technology
Engineering
Information Science
Mathematics
Measurement and Data
Technology
Material Type:
Activity/Lab
Data Set
Diagram/Illustration
Interactive
Author:
Anita Sarma
Justin Dickerson
Lara Letaw
Margarett Burnett
Pam Van Londen
Date Added:
10/02/2024
Coke vs. Pepsi Taste Test: Experiments and Inference about Cause
Conditional Remix & Share Permitted
CC BY-NC-SA
Rating
0.0 stars

The Coke vs. Pepsi Taste Test Challenge has students design and carry out an experiment to determine whether or not students are able to correctly identify two brands of cola in a blind taste test.In the first stage of the activity students design and conduct the experiment. In the second part of the activity students use Sampling SIM software (freely downloadable from http://www.tc.umn.edu/~delma001/stat_tools/) to simulate and gather information on what would be expected under chance conditions (i.e., if students obtained correct answers only by guessing). The students then compare the observed results to the chance results and make an inference about whether a given student can in fact correctly identify Coke and Pepsi in a blind taste test. Finally, the experiment is critiqued in terms of how well it met the standards for a good experiment.

This activity allows students to gain a better understanding of the experimental process and causality through considering control, random assignment, and possible confounding variables. The activity also allows students to begin to understand the process of hypothesis testing by comparing their observed results of the taste test to the results obtained through Sampling SIM (which model would be obtained by chance). Students make an inference about whether particular students in their class can truly tell the difference between Coke and Pepsi by reasoning about how surprising the observed results are compared to the simulated distribution of correct identifications by guessing. The activity also provides an opportunity for discussing generalizability to a population.

Subject:
Mathematics
Measurement and Data
Statistics and Probability
Material Type:
Activity/Lab
Data Set
Provider:
Science Education Resource Center (SERC) at Carleton College
Provider Set:
Teach the Earth
Author:
Joan Garfield
Date Added:
11/06/2014
Combustion and Air Quality: Emissions Monitoring
Read the Fine Print
Educational Use
Rating
0.0 stars

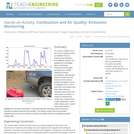
As a class, students use a low-cost air quality monitor (a rentable “Pod”) to measure the emissions from different vehicles. By applying the knowledge about combustion chemistry that they gain during the pre-activity reading (or lecture presentation, alternatively), students predict how the emissions from various vehicles will differ in terms of pollutants (CO2, VOCs and NO2), and explain why. After data collection, students examine the time series plots as a class—a chance to interpret the results and compare them to their predictions. Short online videos and a current event article help to highlight the real-world necessity of understanding and improving vehicle emissions. Numerous student handouts are provided. The activity content may be presented independently of its unit and without using an air quality monitor by analyzing provided sample data.

Subject:
Career and Technical Education
Mathematics
Measurement and Data
Physical Science
Material Type:
Activity/Lab
Provider:
TeachEngineering
Author:
Ashley Collier
Ben Graves
Daniel Knight
Drew Meyers
Eric Ambos
Eric Lee
Erik Hotaling
Hanadi Adel Salamah
Joanna Gordon
Katya Hafich
Michael Hannigan
Nicholas VanderKolk
Olivia Cecil
Victoria Danner
Date Added:
02/07/2017