This is an activity for an upper-level geomorphology course that emphasizes descriptive …
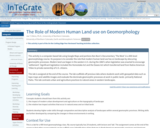
This is an activity for an upper-level geomorphology course that emphasizes descriptive analysis of human land use and its impact on landscape. It compares developed areas vs. natural areas within geomorphic provinces using web-based geospatial data (maps and satellite images) to evaluate the dominant geomorphic processes at work within landscapes.
This is a research project designed for 3-5th grade using digital resources …
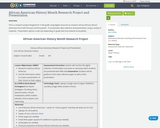
This is a research project designed for 3-5th grade using digital resources to research various famous African Americans from both the past and the present. It incorporates data collection and presentation using a variety of materials. Presentation options could vary depending on grade level and material accessability.
This file contains two activities created by Robert Wagner of Harrisburg Area …
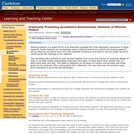
This file contains two activities created by Robert Wagner of Harrisburg Area Community College. The Scientific Article Assignment provides a framework for students to analyze and interpret a level-appropriate scientific article. The Solar Observation project guides students through a more extensive observation activity, and includes a setup for data recording and reporting.
An introduction and examples of how to use Multiple linear regression. The …
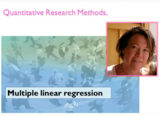
An introduction and examples of how to use Multiple linear regression. The Linear regression model investigates a linear relationship. The dependent variable should be quantitative and normally distributed. The Multiple Regression Model includes more than one independent variable. The Multiple Regression Model is introduced with real data from the Swedish pregnancy register.
This workshop involves students in evaluating the efficacy of posters as a …
This workshop involves students in evaluating the efficacy of posters as a communication tool, focusing on elements of clarity in poster and graphic design.
This workshop entails the reading of a highly quantitative article, summarizing it …
This workshop entails the reading of a highly quantitative article, summarizing it for a different audience, and reflecting upon what choices and opportunities audience presents for quantitative writers.
Complément d’exercices théoriques et pratiques en complement du livre Algorithms, 4th Edition …
Complément d’exercices théoriques et pratiques en complement du livre Algorithms, 4th Edition de Robert Sedgewick and Kevin Wayne pour une classe inversée.
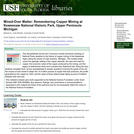
Spreadsheets Across the Curriculum/Geology of National Parks module. Students calculate the amount …
Spreadsheets Across the Curriculum/Geology of National Parks module. Students calculate the amount of rock removed and the value of copper produced at the great Keweenaw District up to 1925.
Qualitative research has long suffered from a lack of free tools for …
Qualitative research has long suffered from a lack of free tools for analysis, leaving no options for researchers without significant funds for software licenses. This presents significant challenges for equity. This panel discussion will explore the first two free/libre open source qualitative analysis tools out there: qcoder (R package) and Taguette (desktop application). Drawing from the diverse backgrounds of the presenters (social science, library & information science, software engineering), we will discuss what openness and extensibility means for qualitative research, and how the two tools we've built facilitate equitable, open sharing.
This resource is a video abstract of a research paper created by …
This resource is a video abstract of a research paper created by Research Square on behalf of its authors. It provides a synopsis that's easy to understand, and can be used to introduce the topics it covers to students, researchers, and the general public. The video's transcript is also provided in full, with a portion provided below for preview:
"Climate change is altering our world as we know it Despite general guidelines for mitigating harmful changes Climate change affects different areas in different ways And those effects aren’t always clear Now, a new evidence-based tool could provide the resolution to tailor plans of action around the globe It starts with a meta-analysis that gathers climate change data for a given ecosystem That data provides the input needed to draw conclusions about future climate trends, or scenarios Such as increases or decreases in temperature The effects those changes are likely to set in motion are then linked together in a causal chain Which can reveal how crops, natural resources, or animal species will fare amid climate change Although the tool becomes limited when data for a given area are scarce It could be a powerful new way to develop custom-made plans for fighting climate change.."
The rest of the transcript, along with a link to the research itself, is available on the resource itself.
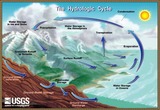
This activity will show students how to determine rate of evaporation and …
This activity will show students how to determine rate of evaporation and the atmospheric factors that can affect this rate. Laboratory equipment needed for this investigation includes: a digital balance or triple beam balance, metric ruler in millimeter graduations, level, 2 metal pans, barograph (or barometer), hydrograph (or hygrometer), thermograph (or thermometer), anemometer, rain gauges and quart jar. Teacher background information, assessment suggestions, and a scoring rubric are included. This is Activity 1, in the learning module, Water: Here, There and Everywhere, part of the lesson series, The Potential Consequences of Climate Variability and Change.
Students are introduced to the basic concepts of computer programs, algorithms and …
Students are introduced to the basic concepts of computer programs, algorithms and programming. Using a few blindfolds and a simple taped floor maze exercise, students come to understand that computers rely completely upon instructions given in programs and thus programs must be comprehensive and thorough. Then students learn to program using the LEGO MINDSTORMS(TM) NXT software. They create and test basic programs, first using just the LEGO NXT intelligent brick, and then using basic movement commands with the LEGO NXT software on computers. A detailed PowerPoint® presentation, plus a worksheet and pre/post quizzes are provided.
Students will be working with the problem “How do we know water …
Students will be working with the problem “How do we know water is safe to drink?” under the theme of “How does access to clean water and sanitation affect a culture?” Students participate in labs related to the hydrologic cycle and water quality. Students design and build a local watershed to model the movement of water across land. Students also research and explore print, video, and audio resources for news and information about local / global water pollution / impact by and on humans.Students share what they have researched with each other, then create an artifact (infographic, video, slideshow, animation, comic strip, etc) intended to educate peers and younger students about water quality and its importance. Ideally, finished products would be shared with others in an authentic setting.Standards:Ohio Science Standards (Grade 7)CCSS English Language Arts (Grade 7)
This guide walks you through the "Be Internet Awesome" Digital Citizenship games …
This guide walks you through the "Be Internet Awesome" Digital Citizenship games and curriculum created by Google for grades 2-6 (although older students might also enjoy the games). The games are extremely engaging and can be played on their own--or accompanied by their corresponding lessons. The lesson plans provide everything educators need to begin teaching this content in their classrooms
This lesson is about the estimation of the value of Pi. Based …
This lesson is about the estimation of the value of Pi. Based on previous knowledge, the students try to estimate Pi value using different methods, such as: direct physical measurements; a geometric probability model; and computer technology. This lesson is designed to stimulate the learning interests of students, to enrich their experience of solving practical problems, and to develop their critical thinking ability. To understand this lesson, students should have some mathematic knowledge about circles, coordinate systems, and geometric probability. They may also need to know something about Excel. To estimate Pi value by direct physical measurements, the students can use any round or cylindrical shaped objects around them, such as round cups or water bottles. When estimating Pi value by a geometric probability model, a dartboard and darts should be prepared before the class. You can also use other games to substitute the dart throwing game. For example, you can throw marbles to the target drawn on the floor. This lesson is about 45-50 minutes. If the students know little about Excel, the teacher may need one more lesson to explain and demonstrate how to use the computer to estimate Pi value. Downloadable from the website is a video demonstration about how to use Excel for estimating Pi.
The course will cover several key models as well as identification and …
The course will cover several key models as well as identification and estimation methods used in modern econometrics. We shall being with exploring some leading models of econometrics, then seeing structures, then providing methods of identification, estimation, and inference. You will get lots of hands-on experience with using the methods on real data sets.
This three-week project begins with a measurement of "baseline" consumptive behavior followed …
This three-week project begins with a measurement of "baseline" consumptive behavior followed by two weeks of working to reduce the use of water, energy, high-impact foods, and other materials. The assignment uses an Excel spreadsheet that calculates direct energy and water use as well as indirect CO2 and water use associated with food consumption.
(Note: this resource was added to OER Commons as part of a batch upload of over 2,200 records. If you notice an issue with the quality of the metadata, please let us know by using the 'report' button and we will flag it for consideration.)
In this hands-on OLogy activity, kids learn how the mammalian diving reflex …
In this hands-on OLogy activity, kids learn how the mammalian diving reflex works to help both land and sea mammals survive in cold water. The activity begins with a kid-friendly look at the way all mammals' bodies respond similarly when exposed to cold water. The illustrated, step-by-step directions show how to test the effect cold water has on circulation by measuring the pulse before and after they plunge their faces into icy water. It includes a fast fact about how the mammalian diving response is stronger in children than in adults.
A quiz is a form of mind spot attempt to answer questions correctly. It is …
A quiz is a form of mind spot attempt to answer questions correctly. It is a game to test knowledge about a certain subject. In some countries, a quiz is also a brief assesment used in education and similar fields to measure growth in knowledge, abilities and skills. This Assessment is based on multiple choice questions for all competitive exams. We are providing you different MCQs on different topics of Indian Economy so that you can check your knowledge on different topics related to Indian Economy.
No restrictions on your remixing, redistributing, or making derivative works. Give credit to the author, as required.
Your remixing, redistributing, or making derivatives works comes with some restrictions, including how it is shared.
Your redistributing comes with some restrictions. Do not remix or make derivative works.
Most restrictive license type. Prohibits most uses, sharing, and any changes.
Copyrighted materials, available under Fair Use and the TEACH Act for US-based educators, or other custom arrangements. Go to the resource provider to see their individual restrictions.