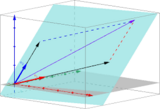
Students construct a geologic map of a region of Venus' surface using …
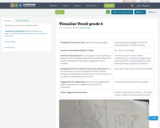
Students construct a geologic map of a region of Venus' surface using NASA Magellan synthetic aperture radar(SAR) data (provided) and/or synthetic stereo data (provided, and constructed using Magellan SAR and altimetry data)- 3D anaglyph viewed through red-blue glasses. Mapping can be done digitally using Adobe Illustrator (or a similar graphic program) or using hard copy images and overhead transparencies for mapping. Students construct a complete geologic map, determine a geologic history for the area, and propose hypotheses for the evolution of a large quasi-circular geomorphic/geologic feature that occurs within the map area. Students also propose tests of their hypotheses (whether such tests can be accomplished through further mapping, future missions, experiments, theoretical arguments, calculations, etc.). Students must clearly identify assumptions they make in their hypotheses/models. Individual, or small group, write-ups and completed geologic maps summarize student analysis. This activity connects structural geology to other fields, and provides the students with an opportunity to experience geologic investigation in which there is no single right answer, but there are "wrong" or unlikely hypotheses. This exercise helps students think outside the box with little fear given that they are dealing with - literally - an extraterrestrial world in which very little is known - and yet, we assume that chemistry and physics, as we know them, likely operated on Earth's sister planet. Students are given a short introductory presentation about the environmental conditions of Venus (which could have been different in the past), and an introduction to radar data before they begin.
(Note: this resource was added to OER Commons as part of a batch upload of over 2,200 records. If you notice an issue with the quality of the metadata, please let us know by using the 'report' button and we will flag it for consideration.)
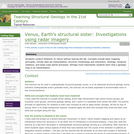
Verifying social media posts is quickly becoming a necessary endeavor in everyday …
Verifying social media posts is quickly becoming a necessary endeavor in everyday life, let alone in the world of education. Social media has moved beyond a digital world which connects with friends and family and has become a quick and easy way to access news, information, and human interest stories from around the world. As this state of media has become the "new normal," especially for our younger generations, we, educators, find ourselves charged with a new task of teaching our students how to interact with and safely consume digital information.The following three modules are designed to be used as stand-alone activities or combined as one unit, in which the lessons can be taught in any order. "Who Said What?!" is a module focusing on author verification. "A Picture is Worth a Thousand Words'' is a module devoted to image verification. "Getting the Facts Straight" is a module designed to dive into information verification. Lastly, there are assessment suggestions to be utilized after completing all three modules.
This lesson is about water, language arts, and math are both incorporated in this …
This lesson is about water, language arts, and math are both incorporated in this lesson. Students in first grade will enjoy these games and activities as they are learning.
This resource provides access to videos produced and/or used by the Northern …
This resource provides access to videos produced and/or used by the Northern California Training Academy to support training for child welfare practitioners. To learn more about the Academy, please visit humanservices.ucdavis.edu/academy.
This is an anonymous electronic peer review exercise that utilizes a dropbox, …
This is an anonymous electronic peer review exercise that utilizes a dropbox, where students detail and support their viewpoint on nonhuman-induced global warming.
(Note: this resource was added to OER Commons as part of a batch upload of over 2,200 records. If you notice an issue with the quality of the metadata, please let us know by using the 'report' button and we will flag it for consideration.)
This GIS lab exercise investigates the use of the ArcGIS Spatial Analyst …
This GIS lab exercise investigates the use of the ArcGIS Spatial Analyst extension tools to construct a viewshed of the Chaco Canyon area in New Mexico. Students will build a simple point location map of several ruins in Chaco Canyon. Assuming that some of the cliff-top ruins were used as lookout towers, viewshed analysis is applied to see if this was possible.
The “Retail Quest” virtual field trip app allows students to learn about …
The “Retail Quest” virtual field trip app allows students to learn about systems modeling by observing Point-of-Sale (POS) systems at the Mall of America and applying what they’ve observed to systems models such as use case and activity diagrams. The app allows students to visit mall locations virtually or physically, whichever they choose. You can use the Retail Quest app in your courses by importing it into your Learning Management System (LMS). Figure 1. Introduction Screen in Retail Quest App
This Remote Learning Plan was created by Joanna Pruitt as part of …
This Remote Learning Plan was created by Joanna Pruitt as part of the 2020 ESU-NDE Remote Learning Plan Project. Educators worked with coaches to create Remote Learning Plans as a result of the COVID-19 pandemic.The attached Remote Learning Plan is designed for Grades 9-12 English Language Arts students. Students will learn the research process and how to write a research paper. It is expected that this Remote Learning Plan will take students 4-5 weeks to complete.
To eliminate disposable assignments, students will produce a classroom zine together for …
To eliminate disposable assignments, students will produce a classroom zine together for use in future classes. Future classes will build upon previous students’ work by adding to it, remixing it, or reusing it.
This Learning Plan was created by Mae Clausen. Educators worked with coaches …
This Learning Plan was created by Mae Clausen. Educators worked with coaches to create Learning Plans.Brief Overview: Students will analyze and evaluate the comphrension strategy of visualization to clarify text and deepen understanding of the text. Students will use background knowledge to build on new knowledge and connect to the texts. Grade Level: 3rd gradeLexile Level: 420-820 Scarecrow Read Aloud: AD 600LNDE Standards: LA 3.1.6.l Build background knowledge and activate prior knowledge to identify text-to- self, text-to-text, and text-to-world connections before, during, and after reading.LA 3.1.6.n Make and confirm/modify predictions and inferences before, during, and after reading literary, informational, digital text, and/or media.Learning Objective: Students will be able to define visualization and notice it while reading and/or listening to books or short passages. Duration: 90-120 minutes to complete.
This is a take-home exercise for junior or senior-level students in a …
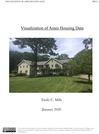
This is a take-home exercise for junior or senior-level students in a Sedimentation/Stratigraphy course. It may be used to bridge topics of geomorphology, depositional environments and clastic sedimentology. The exercise focuses on visualizing journal article data in a meaningful way. In addition to defining technical terms, students are asked to use background knowledge of Walther's Law to complete a series of vertical sections. Approximate time to complete the exercise is 4-5 hours. Individual assignment (as opposed to group work) is recommended.
(Note: this resource was added to OER Commons as part of a batch upload of over 2,200 records. If you notice an issue with the quality of the metadata, please let us know by using the 'report' button and we will flag it for consideration.)
This curriculum guide offers a list of Open Educational Resources (OER) that …
This curriculum guide offers a list of Open Educational Resources (OER) that are arranged in a logical sequence for introducing polynomials with visual models, particularly using arrays and area models.
No restrictions on your remixing, redistributing, or making derivative works. Give credit to the author, as required.
Your remixing, redistributing, or making derivatives works comes with some restrictions, including how it is shared.
Your redistributing comes with some restrictions. Do not remix or make derivative works.
Most restrictive license type. Prohibits most uses, sharing, and any changes.
Copyrighted materials, available under Fair Use and the TEACH Act for US-based educators, or other custom arrangements. Go to the resource provider to see their individual restrictions.